Research Article - Annals of Biological Research ( 2018) Volume 9, Issue 2
Microalgae are excellent source of triglycerides and many other economically important chemicals which have a huge application in the production of Biodiesel and Food processing. Utilization of CO2 present in flue gas by microalgae has gained tremendous attention in the recent years. Carbon dioxide supplied from the flue gas emission pipes of turbines can be the most significant nutrient for the mass scale cultivation of microalgae. In this respect, screening of a suitable species of microalgae capable of growing using concentrated CO2 from flue gas is a challenge. In this study one oleaginous microalgae strain S. obliquus was investigated to observe the effect on growth, biomass production and lipid content by supplying two concentrations of CO2 (15% and >25%) during period of January to December in a serially connected closed photo-bioreactor system. The observation showed maximum biomass concentration of 2.89 g/L and the results indicated 40% higher lipid content for S. obliquus under 15% CO2 relative to lipid content in higher CO2 (>25%) concentration. The recovered biodiesel had higher heating values of 36 MJ kg−1 and contained 28-35% oil having high levels of C16 and C18 fatty acids. The cultivation season was projected to be efficient for 10 months and waste heat drying of the biomass is suggested for two winter months. The technique is proposed for carbon sequestering and energy storage in the form of microalga dry biomass for later conversion into Biofuels.
Microalgae, Carbon sequestration, Photo bioreactor, Flue gas, Biomass production, Lipid analysis
With increasing carbon dioxide concentration in the atmosphere, global warming and rise in water levels have become a threat to the environment. Burning of fossil fuels is considered the prime source of CO2 imbalance. Currently approximately 54% of CO2 in the atmosphere is contributed by global warming [1]. It is studied that the utilization of some industrial waste resources may aid substantially in addressing the challenges to minimize energy and material costs. CO2 separation from flue gas is procuring inquisitiveness because of its cost effective and environment friendly nature [2]. The use of microalgae for CO2 assimilation have various benefits. Microalgae have nearly 20 times greater efficiency of photosynthesis then that of terrestrial crops (Skjanes et al., 2007) [3]. Added to that they are rich source of renewable energy and their by-products can be utilized for manufacturing of high value product. Microalgae when grown in closed photobioreactors have always shown better biomass productivity compared to open mass scale cultivation, this is due to better monitoring over physical parameters, regulated nutrient and gas supply and conducting sterile operation. Microalgae can utilize CO2 from different sources, such as atmospheric CO2; industrial exhaust gases, or CO2 in the form of soluble carbonates (e.g. NaHCO3 and Na2CO3). Bicarbonate (HCO3 −) is the predominant form of dissolved inorganic carbon(DIC) in seawater(pH=8) and the utilization of either CO2 or HCO3 − as the preferred carbon source for photosynthesis and as effective cosupplementation has been found to be species dependent. Furthermore, the differing objectives of the present algae research (biomass, lipid and/ or carbohydrate productivity or CO2 bioremediation efficiency of different strains, etc.) necessitate integrated projects that explore optimized conditions for various growth parameters and bioremediation efficacy [4]. At present, algae are cultivated for different purposes such as various renewable fuels (bioethanol, biodiesel, biomethane, biohydrogen etc.) and nutrition vitamins, minerals, proteins, fats, sugars, antioxidants, animal feeds, cosmetics, pharmaceuticals, chemicals, bioactive neutraceuticals, biofertilisers, and bioremediation. It is clear that multi-parameter optimization techniques are required to determine the most appropriate algae strains, growth conditions, and input parameters suitable to abroad range of industrial scale algae cultivation. Yet, biomass productivity plays a significant role in any microalgae production system, and the production of many target constituents is dependent on primary biomass productivity (including the production of lipids, hydrocarbons, polysaccharides and other energy storage compounds) [5].
Power plant in Duliajan (upper Assam) use Natural gas turbines to generate electricity and they expel large amount of exhaust gases, containing 5-15% CO2, into the atmosphere. The power plants also use formation water from oil drilling sites to cool their system, which is ultimately discarded in the aquatic zones near the plants. The purpose of the present study was to test outdoor microalgal cultivation in serially connected closed photobioreactors to give analysis on actual biomass production, bio-oil quality, and energy efficiency for the cultivation. S. obliquus microalgae which is a fresh water indigenous species of Assam is used to capture CO2 in flue gas for mass production potential for one year. This study was focused on both cost effectiveness and high productivity. It was based on low-frequency harvesting and pumping because these activities are generally accepted to constitute the major energy costs in algae cultivation systems, as exemplified in the NASA Omega project [6]. Moreover, we deliberately sacrificed biomass quality to gain energy efficiency and therefore, traditional biorefinery concepts where high value products cover the costs for bulk products were abandoned. The cultivation concept was based on circulation in the surface layers and flocculation and settling in the stagnant bottom layers of the ponds. As cell growth increases exponentially with temperatures up to about 45°C. Special algal cultivars were designed to accommodate flue gas and waste heat to minimize energy use for gas delivery and mixing. The designs were inspired by sedimentology and the biogeochemical cycle of algae proposed by Redfield and named after the oil formation process in the Tethys sea 200 M years ago [7]. This sedimentation concept was mimicked in the pond systems, allowing algal biomass to grow in gently mixed surface layers and continuously build up bottom sediments before harvesting. The idea was to make use of solar and/or waste heat drying to harvest a thick sludge or dry (> 95% w/w) biomass material.
Setting of photobioreactors
A set of continuously connected series of polycarbonate photobioreactor (PBR) columns (inner diameter 250 mm, height 500 mm) was placed outdoor (22-40 °C) and continuously aerated flue gas containing 5-15% (v/v) of CO2 and no other oxides of Sulphates and Nitrates exist due to the absence of the same in the natural gas. Such design of PBR allow forward flow of culture by force of gravity [8]. The algal suspension volume in each column was 1800ml The PBR was provided with a constant supply of 0.45 μ membrane filtered air at constant a flow rate of 4.57 /min. The PBR’s were connected in such a way that forward flow to culture with the nutrient is possible from the first unit as a inoculating tank which carries fresh nutrient medium for second unit onwards. connections were made in such a way that forward flow of growing culture was possible so that the first PBR unit acts as the inoculating unit for second PBR unit onwards. The loading of nutrient medium from the nutrient delivery unit was directly connected to the first PBR unit (inoculating unit) replenishing with fresh nutrient medium. Each unit was provided with independent air + CO2 supply and can be detached/replaced without disturbing the flow of culture [9]. 10 PBR units were used in this study, while the number of unit connection could be increased as desired. From, the 3rd PBR units onwards up to 9th PBR unit were designated as proliferation units, while the harvesting done from 10th unit. The rate of harvesting was 1 L/h, which was also the rate of nutrient delivery and rate of flow culture.
Culturing conditions
The original growth medium based on the elementary composition of algal biomass had the following initial composition (mg L−1): The experiments were carried out in the batch regime with one supplementary nutrient addition; on the third day of the cultivation, nutrients (inorganic salts) were added at the amount corresponding to their initial concentration in the growth medium [10]. Each experiment was carried out in three replicate columns. The concentration of the suspended algal biomass was determined both by optical density measurement (750 nm) and dry biomass weight determination. The dissolved O2 was measured in the culture suspension. The pH of cultures was kept within the range 6.5–7.5 by the addition of 1 M NaOH. The growth conditions chosen were optimal for the given type of bioreactor and algal species used (Doucha 1979) [11]. Distilled water was added daily in order to eliminate the effect of water evaporation during the cultivation.
Inoculum setup
This study used S. obliquus microalgae obtained from The Culture Collection of Algae at the University of Gauhati at Guwahati. Initially the culture started in sterile petri-dishes containing solid nutrient rich medium and 15% (w/v) agar and was maintained in a 24-hour low light setup. The colonies were then transferred to baffied Erlenmeyer flasks containing 200 mL of nutrient rich medium detailed below and kept on an illuminated shaker table. The cultures were then transferred to a 1L sterile PBR illuminated at 156μmol m−2 s−1 on a 16/8 hour on/offi duty cycle and maintained at 24°C ± 1 °C [12]. The culture was mixed with air enriched with CO2 maintained at 1.5 L min-1 and 20 mL min−1, respectively. The pH was maintained at 7.0 ± 0.1 through injection of CO2 at the rates outlined above based on pH feedback control. Laboratory grade CO2 was utilized in all experimentation so that negligible levels of contaminants from CO2 addition could be assumed. These conditions provided for a steady but relaxed growth rate for the microalgae culture with low light used to minimize light stress and support culture growth at low starting densities. Experimental medium was made following the protocol by Blue Green algal (BG11) medium [13] consisting macronutrient (g/L) NaNO3 (1.5), CaCl2·2H2O (0.036), MgSO4·7H2O (0.075), KH2PO4 (0.04), NaCO2 (0.020), EDTA-FeNa (0.001), citric acid (0.006), ammonium ferric citrate (0.006) and micronutrient (mg/L) H3BO3 (0.061), Na2MoO4·2H2O (0.013), MnSO4·5H2O (0.169), ZnSO4·7H2O (0.287), CuSO4·5H2O (0.003), Co(NO3)2.6H2O (0.049). Analytical grade reagents were used, and the medium was autoclaved at 120 °C for 30 min.
Measurement of cell growth
The cell concentration was measured by measuring the optical density at 680 nm and comparison with calibration curves. For each species, the total suspended solid (TSS) of the standard solutions were measured and the calibration curve was the linear equation between TSS values and measured optical density at 680 nm [14].
To calculated the biomass productivity (Bp) (g/L/day) from change in biomass concentration during cultivation time, Equation 1 was used.
 (1)
(1)
Where X1 is final concentration of biomass, X0 is initial concentration, t1 is final time and t0 is initial time. Specific growth rate μ (1/d) was calculated according to Equation 2 [15].
Biomass growth measurement
PBRs were inoculated at a density of >0.6 OD and 1gram dry weight per litre of medium with a total volume of 15 L per reactor. Daily growth was measured through optical density (OD) at 680 nm and correlated to total suspended solids (g·L−1) based on previous dry mass experimentation (R2=0.9995). Periodic dry mass measurements were taken to confirm OD. OD was measured daily from all reactors [16].
Experiments and procedure
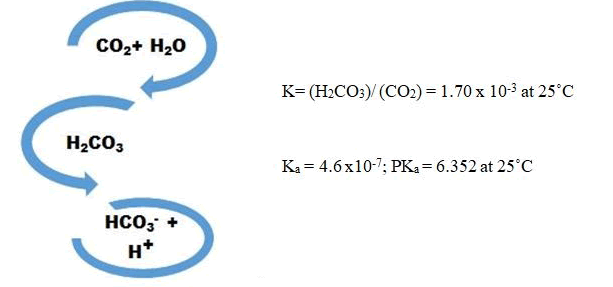
To investigate the supplementing CO2 from flue gas for microalgae growth, the cultivation of S. obliquus was simulated under concentrated CO2 by addition of bicarbonate and decreasing the pH of the media. If we consider the CO2 reactions in water [20].
By considering CO2 concentration as 15 and >25% (v/v), concentration of bicarbonate can be calculated using reactions’ equilibrium equations. In this regard, the accurate amount of bicarbonate was added to the culture throughout the cultivation experiment. In order to calculate the daily carbon dioxide fixation amount (Rf), according to microalga growth, Equation 3 is suggested:
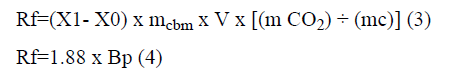
Where mcbm is carbon content ratio of microalgal species, V is cultural volume and mCO2 and mc are the molar mass of carbon dioxide and carbon.
Equation 3 can be simplified to Equation 4. 1.88=×f R Bp
Lipid content determination by folch method
Microalgae with a dry mass of about 1 g were oven-dried at 105 ˚C for 2 h. The dry mass was ground using a mortar and pestle with the aid of glass beads. Chloroform (16 mL) and methanol (8 mL) were added in sequence to the ground algae sample and mixed for 1 h before the second solvent was added. The mixture was then transferred into a separator funnel, where 6 mL saline (9% NaCl) water was added. The sample was given enough time for phase separation with occasional gentle mixing [17]. The lower chloroform phase was collected and another portion of 20 mL chloroform was added to the upper layer. The chloroform phase from the second separation was then collected and combined with previous chloroform solvent phase. The solvent was rotary evaporated and the total lipid was then dried in a vacuum oven. The resulting lipid was weighed and dissolved in chloroform: methanol (2:1, v/v) for storage at 4˚C.
Esterification and transesterification of free fatty acids and triacylglycerols
For the bands containing free fatty acids and triacylglycerols, 2 mL chloroform, 4 mL methanol, and 0.5 mL concentrated sulfuric acid were added to the scraped silica band and the mixture was vigorously mixed. A known amount of methyl heptadecanoate was mixed with the silica gel before the reaction started. The reaction was conducted in a 20-mL glass vial in a boiling water bath for 1 h, then 1 mL water was added to stop the reaction, and fatty acid methyl esters (FAME) were extracted three times by using 4 mL hexane [18].
GC- FID and GC-MS analysis
The silica gel column fractionated lipid-hydrocarbon fraction of the lipid extract by n-hexane soxhlet extraction was subjected for GC analysis. Preliminary identification and quantitative estimation of the major hydrocarbons was achieved using an Agilent 6890N GC system equipped with a flame ionization detector (FID). A DB-1 fused-silica capillary column (15 m× 0.32 mm× ID 0.25 μm) was used. Oven temperature was programmed at 75°C to 230°C at a rate of 25°C / min and then to 340°C at a rate of 10°C / min with a holding time of 10 min at 340°C [19]. The injector and detector temperatures were 300°C and 350°C respectively. Identification and quantification of the major hydrocarbon groups were done based on the comparison with authentic standards (nC8 to nC36 aliphatic hydrocarbons, Sigma Aldrich) and following the standard method according to TNRCC METHOD 1005, respectively. The relative amount of individual components was expressed as percent peak areas relative to total peak area. Molecular analysis of the hydrocarbon extract was achieved using a GC-MS (Perkin-Elmer, Turbomass Gold, Mass Spectrometer) system equipped with SPB-1 (poly(dimethysiloxane)) capillary column (30 m× 0.32 mm ID× 0.25 μm film thickness). Oven temperature was programmed at 130°C to 280°C at a rate of 3°C / min. Compounds were identified from the mass spectra based on comparison with the NIST and Willy GC-MS Libraries.
Fuel properties of Algal biodiesel
The characteristics of algal biodiesel were evaluated with respect to the following properties: acid number, calorific value, cetane number, flash point, ash content, and pour point. GC-MS peaks were also analyzed to determine the constituents present in the crude algal biodiesel.
Experimental data were analyzed from at least three replicates using Graph Pad Prism 5.0 for windows. Comparisons of means were conducted by one-way analysis of variance (ANOVA), followed by Bonferroni tests to identify the sources of detected significance. Significance level was set at p<0.05. The results were expressed as mean ± SE (Standard Error) or ± SD (Standard deviation).
Biomass production and CO2 fixation
Growth and Biomass production in PBR outdoor culture system
The evaluation of the examined microalgae showed the higher growth and as a result higher biomass productivity and carbon dioxide fixation S. obliquus at 15% carbon dioxide concentration. Although, while CO2 concentration increases, the growth of microalgae is inhibited due to reduction of pH but S. obliquus utilize the inorganic carbon of flue gas from power plant as a result of its higher biomass productivity and energy production. The higher lipid content of S. obliquus made it suitable choice for biofuel production. Table 1 and Table 2 exhibits the biomass concentration (g/L), specific growth rate [μmax(1/day)] and Lipid productivity during cultivation time (day) for CO2 concentration at 15% and >25% CO2 respectively. Our results indicated the maximum biomass concentration of 2.89 g/L and 1.42 g/L during the month of July in both the experimental setup. In 15% CO2, 40% higher biomass productivity (0.49 g/L/day) relative to >25% CO2 (0.30 g/L/day). With raise in outdoor temperature and pH a slight increase in biomass have been observed. The maximum lipid productivity of S. obliquus was calculated 0.46 g/L/day at a temperature of 35˚C and pH of 8.7.
| Month | CO2 Concentration | Maxn Biomass Concentration | Maxn specific growth rate µmax(1/day) | Maxn Biomass Productivity Pmax (g/L/d) | Maxn lipid Production g/L |
|---|---|---|---|---|---|
| January | 0.15 | 0.65 | 0.49 | 0.234 | (g/L) |
| February | 0.15 | 0.43 | 0.41 | 0.117 | 0.17 |
| March | 0.15 | 0.58 | 0.36 | 0.204 | 0.26 |
| April | 0.15 | 0.72 | 0.56 | 0.264 | 0.33 |
| May | 0.15 | 1.67 | 0.78 | 0.389 | 0.37 |
| June | 0.15 | 1.82 | 1.49 | 0.428 | 0.43 |
| July | 0.15 | 2.89 | 1.97 | 0.453 | 0.47 |
| August | 0.15 | 2.56 | 1.91 | 0.421 | 0.44 |
| September | 0.15 | 2.02 | 1.87 | 0.432 | 0.45 |
| October | 0.15 | 1.78 | 1.5 | 0.421 | 0.39 |
| November | 0.15 | 1.32 | 0.79 | 0.364 | 0.25 |
| December | 0.15 | 0.86 | 0.55 | 0.321 | 0.21 |
Table 1: Yearly observation and Biomass, Specific growth and Lipid production with 15% CO2.     Â
| Month | CO2 Concentration | Maxn Biomass Concentration | Maxn specific growth rate µmax (1/day) | Maxn Biomass Productivity Pmax (g/L/d) | Maxn lipid Production g/L |
|---|---|---|---|---|---|
| January | >25% | 0.51 | 0.32 | 0.119 | 0.1 |
| February | >25% | 0.38 | 0.39 | 0.114 | 0.23 |
| March | >25% | 0.42 | 0.42 | 0.117 | 0.27 |
| April | >25% | 0.56 | 0.49 | 0.203 | 0.31 |
| May | >25% | 0.65 | 0.59 | 0.234 | 0.34 |
| June | >25% | 1.07 | 0.87 | 0.331 | 0.37 |
| July | >25% | 1.42 | 0.86 | 0.387 | 0.42 |
| August | >25% | 1.32 | 1.39 | 0.364 | 0.39 |
| September | >25% | 1.39 | 1.3 | 0.372 | 0.35 |
| October | >25% | 1.21 | 1.46 | 0.348 | 0.27 |
| November | >25% | 0.78 | 0.65 | 0.27 | 0.21 |
| December | >25% | 0.65 | 0.42 | 0.235 | 0.15 |
Table 2: Yearly observation and Biomass, Specific growth and Lipid production with > 25% CO2 .
CO2 assimilation during the culture period
Varied growth parameters including maximum biomass concentration, maximum specific growth rate and maximum lipid productivity in two concentration of CO2 are compared in Table 1. The effect of high and low concentration of nutrients on microalgae growth is also been consistently investigated in the study. While literature studies showed that increasing carbon source concentration in the media can be advantageous for microalgae production, the high concentration of CO2 can decrease pH and inhibit growth of microalgae. Some studies proposed application of media with high alkalinity for enhanced dissolution of CO2 in media and productivity of microalgae [20,21]. In addition to CO2, the modulation of other macronutrients and micronutrients can enhance the productivity of biomass and valuable products (e.g. lipid) from microalgae.
Nitrogen in the media is shown to be a promising for production of carbon storage compounds which have application in biodiesel production. In this regard, our results suggest the cultivation of S. obliquus with 15% CO2 and low N can lead to higher productivity of biodiesel from microalgae [22]. The results showed a reduction in CO2 fixation ratio from 0.82 to 0.21 g/L/day from 0.66 to 0.12 g/L/day for S. obliquus grown in higher respectively, as CO2 concentration increase from 15% to >25% maximum. If we compare maximum CO2 fixation ratio (g/L/day) S. obliquus in two different CO2 concentrations it can be easily realized that higher CO2 concentration impose less carbon dioxide mitigation.
Utilization of waste for production of valuable products can create opportunities for local and global improvement of economic and environmental sustainability. Among different methods for management of waste, microalgae is specifically significant due to possibility of nutrient utilization from waste streams, high growth rate and capability for production of valuable products (e.g. lipid, protein, pigments) [23]. In this regard, various studies were conducted for use municipal, agricultural and industrial waste for cultivation of microalgae. However, the prior dilution of waste resources is necessary to enhance the productivity and nutrient utilization rate of microalgae [24]. The results of our study suggest that S. obliquus is a suitable species for management of CO2 from flue gas and production of valuable products (e.g. biomass and lipid).
Fuel properties of algal biodiesel
The acid number of algal biomass in this present investigation was determined to be 0.318 mg KOH/g. The acid numbers for algal oil and microalgae B.brauni and Chlorella sp were determined to be 0.56 and 0.34 mg KOH/g, respectively. The biodiesel produced from the Jatropha plant and waste cooking oil resulted in acid values of 0.16 and 0.79 mg KOH/g, respectively. Oil used for frying purpose yielded a higher acid value of 5 mg KOH/g, because of the presence of 1 wt% of water content in the raw oil. Likewise, a high acid number of 2.17 mg KOH/g was observed in fish oil biodiesel. The moisture hydrolyzes the esters present in the biodiesel into alcohol and acids, thereby leading to higher acid numbers.
The moisture hydrolyses the esters present in the biodiesel into alcohol and acids, thereby leading to higher acid numbers. The calorific value of the fuel determines the fuel consumption required to obtain the same energy power output [25]. The biodiesel derived from the algal oil resulted in a value of 36 MJ/kg. The cetane number indicates the quality of the compression ignition of diesel fuel. A larger cetane number for a diesel fuel indicates the shorter ignition delay and duration of the combustion period, less occurrence of knocking, and lower emission of nitrogen oxides [26]. Graboski and McCormick [27] found that the cetane number of biodiesel produced from soybean oil was in the range of 45.7-56.4 min. The cetane number of the biodiesel derived from algal oil in this present investigation resulted in a value of 56 min, whereas biodiesel from marine fish oil, waste cooking oil and corn oil had a value of 51.3,47.9, and 48.7 min, respectively. ASTM standard for the No.2D diesel was determined to be 53.2 min in the case of cetane number [28]. Algal biodiesel produced in this present investigation from freshwater algae resulted in a flash point of 107˚C, whereas Xu et al. [29] stated a value of 115 ˚C with Chlorella sp. The biodiesel derived from the soybean, fish oil and domestic cooking oils by Chen et al. [30] and Lin and Li [31] resulted in values of 104.5, 106, 189, and 144˚C, respectively. Liquid fuel with a high flash point can prevent auto ignition and fire hazards at high temperatures during transportation and storage periods, the biodiesel derived from algae has an edge over the No. 2D diesel.
The ash content of algal biodiesel derived from freshwater algae was determined to be 0.24 wt%. Biodiesel produced from marine fish oil, waste cooking oil, and the ASTM No. 2D diesel were determined to be 0.89, 0.29, and 1.66 wt %, respectively [32]. The existence of impurities, ash and additives in liquid fuel may affect the quantity of carbon residue after the fuel is burned. Thus, burning the algal biodiesel was observed to produce less residual carbon than the biodiesel derived from marine fish oil and waste cooking oil. The density of the biodiesel produced from the freshwater algae had a value of 0.845 kg/L. The pour point in the present investigation had a value of -15˚C, whereas the microalgae Chlorella vulgaris showed a value of-10˚C. The water content in the biodiesel derived from algal oil in this present investigation had a value of 0.01 vol%. Table 4 shows the comparison between the characteristics of algal biodiesel and the Indian standard of biodiesel. The relative weight compositions of organic compounds present in the algal biodiesel was analyzed using GC-MS, as shown in Figure 1 and Table 3. The major compounds were determined to be, viz, Palmatic acid (36.24%), Oleic acid (34.65%), Linolenic acid (14.7%), Linoleic acid (8.21%), 2-Methy tetra cosine (6.83%), 3,7,11-trimethy.2,4 dodecadeine, Hexadecane and 2,6,11,15- tetraethyl. Oleic acid methyl esters improve fuel properties of Biodiesel.
| Properties | Biodiesel from Microalgae oil | Diesel fuel (EN590: 1999) |
|---|---|---|
| Density (Kg/l) | 0.845 | 0.838 |
| Viscosity mm2 /s1 cSTat 40 °C | 4.8 | 2-4.5 |
| Flash Point (°C) | 107 | >55 |
| Acid value (mg KOH/g) | 0.381 | Max 0.5 |
| Heating Value (MJ/Kg) | 36 | 40-45 |
| H/C ratio | 1.71 | 1.81 |
| Solidifying point (°C) | -10 | -50 to 10 |
| Pour point | -15°C | < -10°C |
| Cetane no. | 56 mins | 51 mins |
| Ash content | 0.24%Â mass% | 0.01% mass % |
| Water content | < 0.01% vol% | < 0.03% vol% |
Table 3: Fuel characterization of Biodiesel obtained from July cultivation.
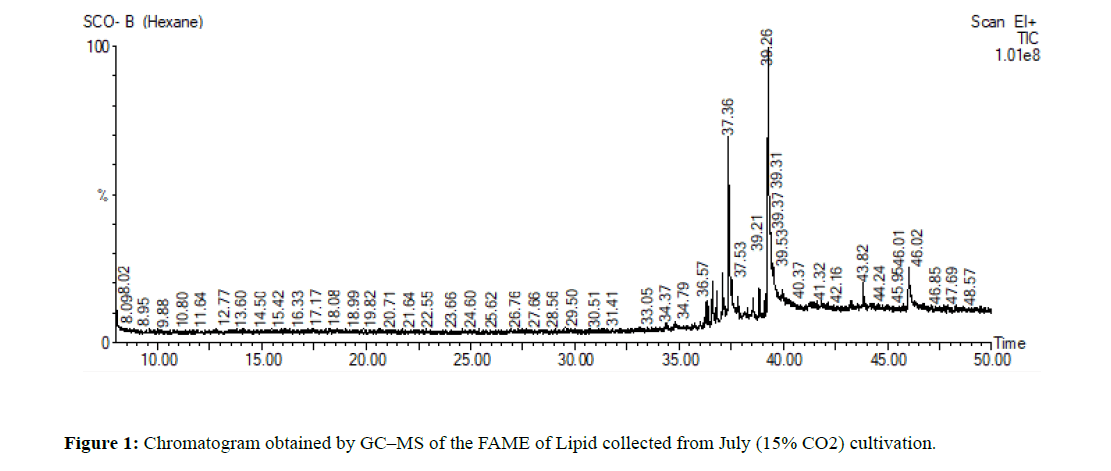
Figure 1: Chromatogram obtained by GC?MS of the FAME of Lipid collected from July (15% CO2) cultivation.
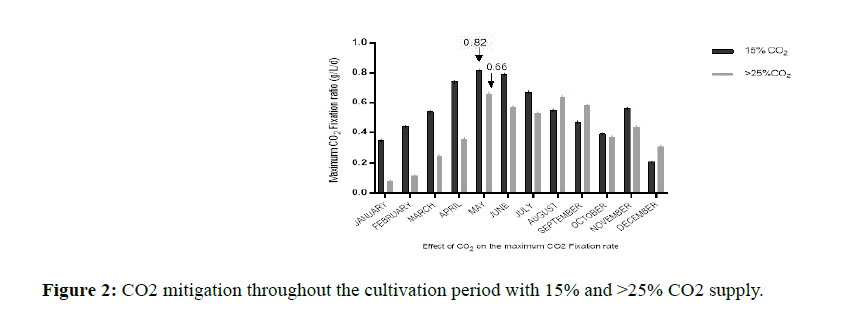
Figure 2: CO2 mitigation throughout the cultivation period with 15% and >25% CO2 supply.
| Fatty acid profile | Amount |
|---|---|
| Palmitic acid (16:0) | 36.24 ± 1.24 |
| Stearic acid (18:0) | 2.67 ± 0.71 |
| Oleic acid (18:1) | 34.65 ± 1.13 |
| Linoleic acid (18:2) | 8.21 ± 0.85 |
| Linolenic acic (18:3) | 14.7 ± 5.21 |
| SAFA | 42.76 |
| MUFA | 29.53 |
| PUFA | 22.15 |
| MUFA+PUFA | 51.68 |
Table 4: Fatty acid profile Biodiesel obtained from July phototrophic cultivation. Data represent mean (±) SE of three replicates.
In this study, we have investigated a potent biodiesel producer, CO2 utilizer and industrially significant species of microalgae S. obliquus. These conditions are simulated through experiment by replacement of carbon dioxide gas with sodium bicarbonate and simultaneous titration in high temperature and pH levels. Our results show higher biomass production and enhancement of lipid content with 15 CO2 % fixation by S. obliquus. The present investigation had proved the successfulness of implementing the biodiesel production from algae as a raw material. Biodiesel extracted from the freshwater algae was comparable in quality with that of conventional biodiesel. Algae has the potential of growing in places away from the farmlands and forests, thus minimizing the damages to the ecosystem and food chain supply. Algae can also be grown in sewage and next to power-plant smoke exhaust, where they can digest the pollutant and use it for producing economically important by-products. Our study suggests that cultivation is a promising technique for CO2 mitigation, developing high-lipid-content microalgae or bioengineering microalgae for biofuel production, because it would be the most promising way in catering the energy demand.
I am grateful to Prof. Mohan Chandra Kalita, Dept of Microalgae Biotechnology, Guwahati University for proving me with laboratory equipment’s, Mr. Hamendra Chandra Das, Director of Innotech Interventions, Guwahati for fatty acids analyses and fuel Characterization. The help from the staff at Centre of Excellence for Petroleum studies personal was very much appreciated.