Research Article - Annals of Biological Research ( 2019) Volume 10, Issue 1
Background: Plantar fasciitis is the most common cause of chronic heel pain in adults. Plantar fasciitis is caused by biomechanical overuse from prolonged standing or running.
Purpose: To compare the plantar fascia thickness and compressibility index of symptomatic foot and asymptomatic foot with sonography in patients diagnosed with unilateral plantar fasciitis. To document the consistent sonological findings in patients with clinically diagnosed plantar fasciitis.
Methods: 60 Patients who were diagnosed clinically with plantar fasciitis of single heel were taken in the study. A lateral radiograph of the involved heel, blood tests, body mass index in kg/m2 were analyzed and subjected to sonography of bilateral heel to check the plantar fascia thickness, heel pad thickness, and compressibility index.
Results: In our study, sonologically mean plantar fascia thickness on the symptomatic side was 4.03 mm and on the asymptomatic side, it was 2.78 mm. P value (0.001) was statistically significant therefore increased the thickness of fascia is associated with plantar fasciitis. Most common ultra-sonographic feature observed in our study was increased plantar fascia thickness and hypoechoic changes compared to the opposite heel.
Conclusion: Sonography of bilateral heel could be used as an initial imaging modality for the investigation of plantar fasciitis. As it can help in assessing the plantar fascia thickness and texture of the plantar fascia which cannot be assessed on X-rays which is the common modality of investigation for this condition. Increased plantar fascia thickness and hypoechogenicity are a consistent ultra-sonographic finding of plantar fasciitis. There is a negative correlation between plantar fascia thickness, heel pad thickness and also compressibility index in assessing the severity of plantar fasciitis.
Sonography, Plantar fasciitis, compressibility index.
Heel pain is a common presenting complaint in our orthopedic practice and plantar fasciitis is the most common cause of chronic pain in the heel in adults. It accounts for 11-15% of the foot symptoms which requires professional care. It is estimated that 1 in 10 people will develop plantar fasciitis during their lifetime [1].
The plantar fascia or plantar Apo neurosis is a tough, fibrous, connective tissue structure that spans the plantar fascia surface of the foot from heel to toes. If it is damaged, degeneration of the fascia occurs and symptoms develop, which is referred to as plantar fasciitis.
Plantar fasciitis is caused by biomechanical overuse from prolonged standing or running, thus creating micro tears at the calcaneal enthesis [2]. Plantar fasciitis is an overuse injury causing inflammation at the origin of the plantar fascia and perifascial structures, like the calcaneal periosteum. The pain is due to the collagen degeneration at the origin of the plantar fascia at the medial tubercle of the calcaneus. This degeneration causes loss of collagen continuity, increase in ground substance (matrix of connective tissue) and vascularity [3]. Plantar fasciitis is due to repetitive micro tears of the plantar fascia that overcome the body's ability to repair itself.
Plantar fasciitis is more common in middle-aged obese females and young male athletes. It is particularly common in runners and overweight people; however, it is consistently reported in people with systemic inflammatory arthritis. It can often be a challenge for clinician’s to successfully treat.
Clinical features
Plantar fasciitis is characterized by pain in the anteromedial aspect of the heel region, which is aggravated by weight bearing after a long period of non-weight bearing and by prolonged weight bearing [4]. Patients usually present with plantar heel pain upon initiation of weight bearing, either in the morning upon arising or after periods of rest.
Excessive foot pronation (pes planus), high arch (pes cavus), leg length discrepancy, obesity (body mass index greater than 30 kg per m2), prolonged standing or walking occupations, sedentary lifestyle, tightness of Achilles tendon and intrinsic foot muscles are all-risk factors for development of plantar fasciitis [2]. Obesity is present in 70% of patients with plantar fasciitis [1]. Heel spurs are a common risk factor for the development of plantar fasciitis [1].
Diagnosis
The diagnosis of plantar fasciitis is usually clinical and the treatment is usually started based on the clinical diagnosis. The role of radiology in the management of plantar fasciitis is to make an accurate diagnosis so that effective treatment of plantar fasciitis can be made and to differentiate it from other causes of heel pain [5]. Conventional radiographic studies of patients with painful heel syndrome are often not useful and calcaneal uptake at radionuclide scintigraphy is a frequent but a nonspecific finding [2].
The plantar aponeurosis sonographically appears as a homogeneous echogenic band with internal linear interfaces on longitudinal sections. Ultrasound demonstrates superficial tissue inflammation and helps visualization of the plantar fascia and superficial structures. Sonography has also the advantage of being noninvasive, well tolerated by patients and inexpensive [6].
The aim of our study was to determine the clinical and sonological correlation of plantar fasciitis and objectives were to compare the plantar fascia thickness, heel pad thickness, and compressibility index of symptomatic foot and asymptomatic foot with sonography in patients diagnosed with unilateral plantar fasciitis [7]. The study was conducted in the department of orthopedics, Bangalore Baptist Hospital over a period of one year. Adult outpatients registered in orthopedics department, Bangalore Baptist hospital who presented with unilateral chronic heel pain and suspected to be having plantar fasciitis. It was a Comparative study (Observational study) [8-12].
A detailed clinical examination was performed. A lateral radiograph of the involved heel with random blood sugar levels and uric acid values were done. Once the X-ray and the blood tests were analyzed, patients height in centimeters and weight in kilograms were calculated and patients body mass index in kg/m2 were calculated. Informed consent was taken from the patients explaining the entire procedure. Patients were then subjected to sonography [13-18].
Inclusion criteria
• Age- skeletally mature patients
• Both the genders
• Patients clinically diagnosed with unilateral plantar fasciitis of more than 4 weeks duration
Exclusion criteria
• Post Traumatic heel pain
• Heel pain treated with surgical intervention and steroid injections
• Metabolic disorders like hyperuricemia, diabetes mellitus
• Infections like osteomyelitis, cellulitis
• Associated neurological conditions like Tarsal tunnel syndrome, S1 radiculopathy
• Patients with arthritis-inflammatory or non-inflammatory like Ankylosing spondylitis
• Reiter's disease, psoriatic arthritis, rheumatoid arthritis, and gout
• Stress fractures of the calcaneum and bone tumors (Figures 1 and 2)
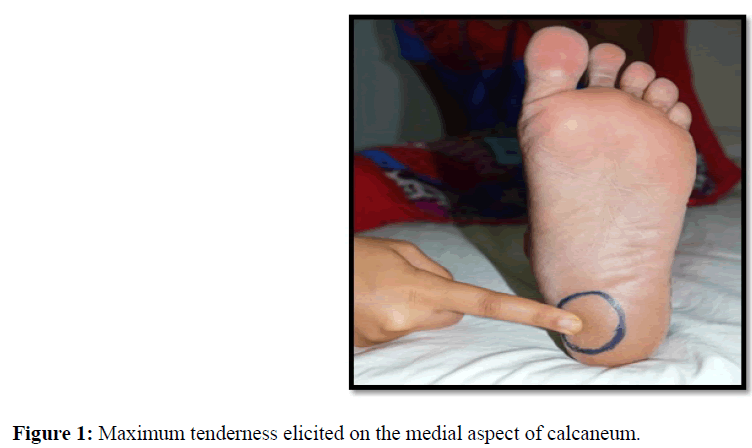
Figure 1: Study design and methodological procedure.
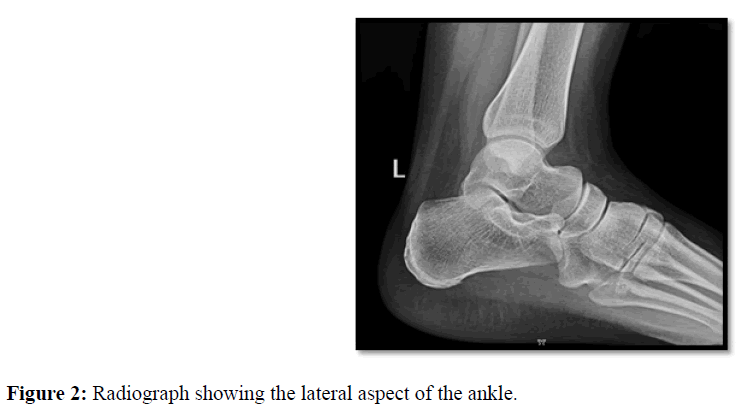
Figure 2: Radiograph showing the lateral aspect of the ankle.
Data was later formulated into a table for comparison and correlation during final data analysis. The study population consisted of 60 patients with heel pain and the clinical characteristics of plantar fasciitis [19-22]. The scheduled ultrasound appointments included a detailed assessment of both the heels on an outpatient basis over a period of 20 minutes. Ultrasound analysis of both heels using a linear array probe (MSK probe) was performed according to the guidelines by a senior radiologist in the department of radiology with experience in musculoskeletal sonography. Ultrasound of both the heels was done, using the asymptomatic heel as the control and the symptomatic heel as the case of the same patient [23].
Sonography of the heel was broadly classified into 5 categories:
• Nature of the plantar fascia
• Plantar fascia thickness
• Heel pad thickness
• Heel pad compression
• Calculation of the compressibility index
Sonographic examinations were performed with a commercially available scanner (LOGIQ 500 PRO; GE Healthcare Milwaukee, WI) and a -5.0 to -12.0 MHz linear transducer. The subjects examined in standing and supine position. The subjects lay prone with their both feet hanging free over the end of the examination couch and their ankles dorsiflexed to 90°. Care was taken to keep the beam perpendicular to the plantar fascia at all times [24-28].
Nature of the plantar fascia
Uniform hyperechogenicity of the plantar fascia was considered a normal finding. The changes in the echogenicity of the symptomatic fascia were evaluated as hypoechoic fascia that stood in contrast to the adjacent hyperechoic fat of the heel pad [29,30] as shown in Figure 3. Sonographic findings of the plantar fascia were assessed as:
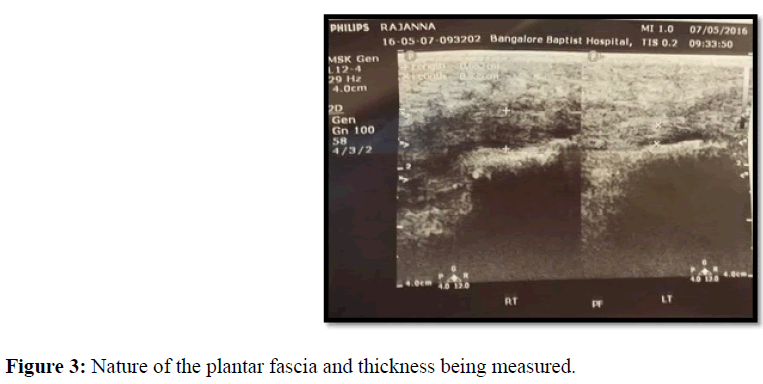
Figure 3: Nature of the plantar fascia and thickness being measured.
• thickening of the plantar fascia
• loss of the fascia edge sharpness
• Echogenicity
• loss of fibers of the plantar fascia
• fluid collections
Plantar fascia thickness
Sagittal imaging of the plantar fascia was performed [31-35], and its thickness was measured at a standard reference point where the plantar fascia crosses the anterior aspect of the inferior border of the calcaneus till midfoot first on the asymptomatic heel followed by symptomatic heel as shown in Figure 4.
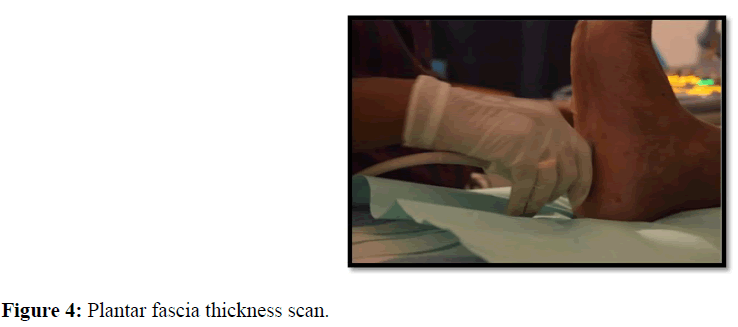
Figure 4: Plantar fascia thickness scan.
Heel pad thickness
Heel fat pad thickness was also measured at the same region between the skin-fat pad interface and the fat padcalcaneal bone interface [36,37]. The unloaded heel pad was measured in a recumbent position first in the asymptomatic feet followed by symptomatic feet (Figure 5).
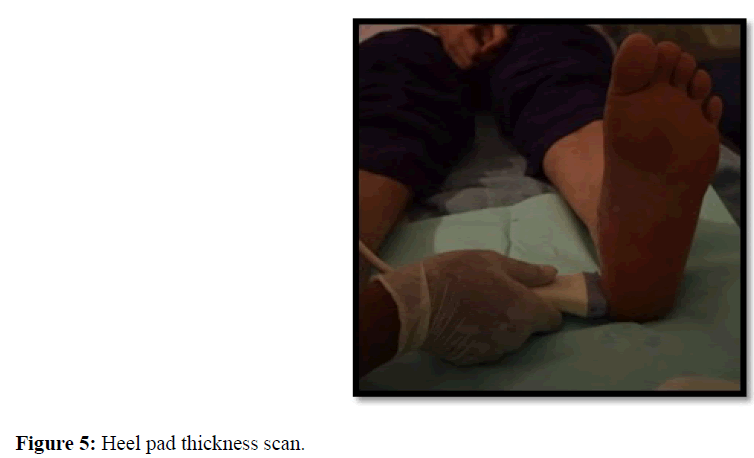
Figure 5: Heel pad thickness scan.
Heel pad compression
The thickness of the heel pad was determined between the skin and the calcaneal tuberosity on the sonogram. To measure the heel pad thickness under static loads, the subjects were instructed to stand with both feet apart over a hard wooden block which was the same used for all patients as shown in Figure 6. Using this method, the ultrasound probe on the heel pad the heel pad compression was calculated for both the feet first in the asymptomatic feet followed by symptomatic feet [38].
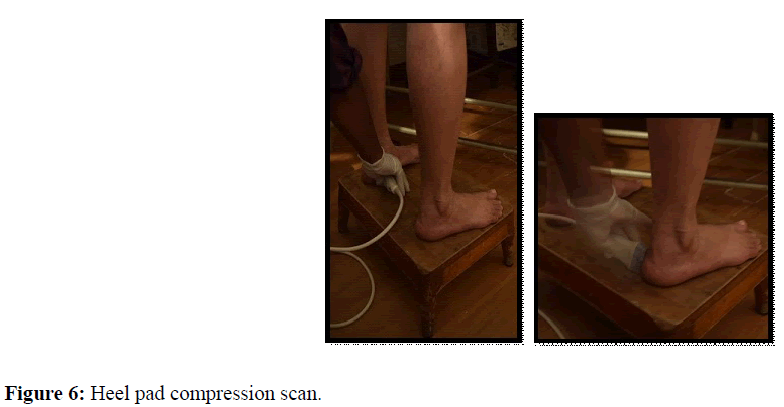
Figure 6: Heel pad compression scan.
Calculation of the compressibility index
Compressibility index was calculated by dividing the change of from a non-load to uniform load condition by the thickness of the unloaded heel pad, expressed as a percentage. It measures the elasticity of the heel pad. Increase in compressibility index indicates loss of elasticity and an increased tendency to develop plantar heel pain. Compressibility index normal values are 1.60-2.71, values greater than 3.09-3577.28 are seen in plantar fascia thickening [6].
Compressibility Index=Heel pad thickness unloaded–Heel pad thickness loaded/Heel pad thickness
Compressibility index was calculated in all patients for both the symptomatic and asymptomatic feet and results were tabulated.
Clinical scoring: The clinical assessment included a detailed history and current problems if any, faced by the patient and past history. This was followed by a detailed clinical examination of the heel. A Visual Analogue scale was explained and handed over to the patient following which they are asked to grade the pain (0=no pain, 10=severe excruciating pain) and the body mass index was calculated [39].
Sonographic assessment: The scheduled ultrasound appointments included a detailed assessment of both the heels on an outpatient basis over a period of 20 minutes. U/S analysis of both heels using a linear array probe (MSK probe) was performed according to the guidelines by a radiologist in the hospital with experience in musculoskeletal sonography. The asymptomatic heel was used as a control and symptomatic heel as a case for the same patient.
Statistical analysis and data management
The data collected was entered into an excel sheet and the analysis was done using the statistical methods mentioned below. Descriptive and inferential statistical analyses were carried out in the present study. Results on continuous measurements are presented on Mean SD (Min-Max) and results on categorical measurements are presented in Number (%). The significance is assessed at 5% level of significance. The following assumptions on data were made:
• Dependent variables should be normally distributed
• Samples drawn from the population should be random
• Cases of the samples should be independent
Student t-test (two-tailed, independent) has been used to find the significance of study parameters on the continuous scale between two groups (Intergroup analysis) on metric parameters. Chi-square/Fisher Exact test has been used to find the significance of study parameters on the categorical scale between two or more groups [40-43].
In our study, it was seen that out of 60 patients the maximum number of cases were in the age group range of 30-39 years and accounted for 31.7% of cases. Mean age of the patients was 41.7 years. The youngest patient was 23 years old and the oldest patient was 60 years old. In our study, we had 13 males and 47 females out of 60 patients. Majority of cases were females contributing to 78.3% and only 21.7% of cases were males. The male to female ratio was approximately 1:4. Most of the affected patients were homemakers (35% of cases) followed by computer professionals (25%). Right heel was the most commonly affected heel accounting to 51.7% followed by left heel accounting to 48.3%. Most of the patients had a VAS score of 3 (41.6%). None of the patients had pain more than 5/10 (VAS). The mean VAS for pain over the affected heel was 3.
Most of the patients with plantar fasciitis had an increased body mass index with a range of 25-30 (46.7%). The number of patients with body mass index greater than 30 was 17 (28.3%). The correlation coefficient between the plantar fascia thickness and body mass index was found to be 0.381 which was statistically significant P value 0.003. A similar study by Nass D, et al. [44] showed an increase in body mass index showed a concomitant increase in heel pad thickness. A BMI value of 28 for both men and women was chosen as the cut-off in his study to assign subjects to the normal weight (N) or the overweight (OV) group [44]. In a study by Somchaiprichasuk showed that the body mass index was greater in patients with plantar heel pain than in normal subjects and 40% of the patients were overweight [12].
Most of the patients had the pain of one-month duration (45 cases) accounting to 75% followed by three months duration (6 cases) accounting to 10%. The correlation coefficient between the plantar fascia thickness and duration of pain was found to be 0.450 which was statistically significant. The P value was 0.000 hence proving that increased duration of pain is associated with an increase in plantar fascia thickening.
In our study, 27 cases out of 60 cases had an increase in plantar fascia thickness that is more than 4mm compared to 34 cases whose plantar fascia thickness was less than 4 mm. But in all the patients (100%) the plantar fascia thickness on the affected side/symptomatic side/cases is more than the control side/asymptomatic side.
In our study, sonographically mean plantar fascia thickness on the symptomatic side was 4.03 mm and on the asymptomatic side, it was 2.78 mm. P value (0.001) was statistically significant hence it can be concluded that increased thickness of fascia is associated with plantar fasciitis. Previous studies were done by E. Cardinal et al., [45] showed that mean plantar fascia thickness on the symptomatic side was 5.2 mm and on the asymptomatic side was 2.9 mm, with a P value which was significant <0.0001. They found that plantar fascia thickness was significantly increased in patients with plantar fasciitis (3.2-6.8 mm, mean 5.2 mm+1-1.13) compared with their asymptomatic heels (2-4 mm mean 2.9 mm+/-0.70) [45]. In a study done by Karabay et al., plantar fascial thickness, echogenicity, and heel pad thickness were evaluated and they concluded that for symptomatic feet, increased thickness of the fascia and reduced echogenicity were constant ultra-sonographic findings (mean 4.79 mm for symptomatic feet; 2.17 mm for control group, P<0.05) which was similar to our study [7]. A similar finding was observed in other studies done by Wall C, et al. [4], Akfirat, et al. [46], and Praveen K. Vohra [5].
Most common ultra-sonographic feature observed in our study was an increased thickness of plantar fascia with hypoechoic changes. Hypoechoic changes can be explained on basis that plantar fascia is like a paratendon rather than a tendon sheath. Fluid distention of the paratendon is usually associated with perifascial edema, which explains the changes in echogenicity [47].
In our study on the comparison of heel pad thickness, mean heel pad thickness on the symptomatic side was 10.18 mm and on the asymptomatic side, it was 10.02 mm but the P value was not statistically significant (>0.595). Analyzing these data it appears that there is no significant correlation exists between heel pad thickness and plantar fasciitis. In previous studies done by Tsai and Chui et al they also observed no difference in heel pad thickness of control and subjects [48]. But Nuran Sabir et al in their study found significant relationships between heel pad thickness and plantar fasciitis [49], Nuran Sabir et al compared sonography with MRI in assessing plantar fasciitis and they found a correlation between plantar fascia and heel fat pad thickness measurements were done by sonography (P<0.001) and MRI (P<0.001). However, MRI was not done in our study.
In our study, the mean heel pad compression was 7.75 in cases compared to 7.52 in controls. But this was statistically not significant. The P value was 0.905. The mean compressibility index was 1.37 in cases compared to 0.03 in controls. But this was statistically not significant as the P value was 1.000. The correlation coefficient between the plantar fascia thickness and compressibility index was -0.102 which was not statistically significant. The P value was 0.437, concluding there is no correlation between plantar fasciitis and compressibility index. The correlation coefficient between the heel pad thickness and compressibility index was found to be 0.283. This was statistically significant and the P value was 0.028. A similar study by Somchaiprichasuk [44] compared heel-pad thickness and compressibility index using lateral radiographs loaded and unloaded by body-weight, was carried out on 70 patients with plantar heel pain and 20 normal subjects and they concluded that the heel-pad thickness and compressibility index was greater in the patients with plantar heel pain than in normal subjects and significantly increased with age, which is similar to our study.
Therefore the heel pad thickness, heel pad compression, and compressibility index are not related to the severity of plantar fasciitis. The pathological changes of plantar fasciitis, therefore, occur only at the level of the plantar fascia and not at the level of the heel pad.
We evaluated a total of 60 patients with unilateral plantar fasciitis. We would like to conclude that sonography of bilateral heel could be used as an initial imaging modality for the investigation of unilateral plantar fasciitis as it can help in assessing the plantar fascia thickness of the symptomatic feet using the asymptomatic feet as the control.
Therefore, from our study, we can conclude that:
• Plantar fasciitis is more common in females than males
• Plantar fasciitis is more common in the age group of 30-39 years
• Increased plantar fascia thickness and hypoechogenicity are a consistent ultra-sonographic finding of plantar fasciitis
Ultrasonography has a definitive role in the diagnosis of plantar fasciitis as:
• It demonstrates superficial tissue inflammation
• Allows visualization of the plantar fascia and superficial structures
• Noninvasive and inexpensive
• Well tolerated by patients
• Heel pad thickness, heel pad compression, and compressibility index are poor markers in assessing the severity of plantar fasciitis
• There is no correlation between plantar fascia thickness and heel pad thickness in assessing the severity of plantar fasciitis
• There is no correlation between plantar fascia thickness and compressibility index in assessing the severity of plantar fasciitis
• We recommend ultrasound as an initial investigation to diagnose unilateral plantar fasciitis using the other heel as the control
• However, heel pad thickness, heel pad compression, and compressibility index are not valuable in assessing the severity of plantar fasciitis
• A follow-up study would be required to check the plantar fascia thickness sonographically after a period of time.
• A limited number of patients was included in the study
• In bilateral cases of plantar fasciitis, the control cannot be used
• Observatory bias in sonography
• Compressibility index values didn’t match the literature values
• In patients who have thick heels, it was difficult to measure plantar fascia thickness and heel pad thickness