Research Article - Journal of Natural Product and Plant Resources ( 2018) Volume 8, Issue 1
Increase in demand and production of automobiles led to unexpected contamination of land around urban areas.
This sudden rise in amount of petroleum hydrocarbon in soil poses great concern to environment. Natural
remediation through microorganism is therefore recommended. In this study we have attempted to identify individual
isolates at local petroleum contaminated sites and prepare consortia to enhance degree of bioremediation. Soil
sample collected from three sites which further investigated for microbial soil respiration and enumerated for THBC
and PDBC growth rate. Distinct colonies were investigated for identification through 16s RNA and protein profiling,
followed by preparation of unique consortium by mixing isolated bacteria. Degradation of petroleum hydrocarbons
were estimated by recording growth rate of individual isolates and consortium. The amount of CO2 evolved in test
samples, i.e., T1, T2 and T3 following addition of 20 mg/kg and 40 mg/kg of Na2CO3 indicated decline by 50%
throughout the period of examination when compared to control. Growth of THBC in test samples were significantly
higher than control (P<0.05). For PDBC the total viable counts were 3.17 × 10⁶ CFU/g, 3.03 × 10⁶ CFU/g and 3.10
× 106 CFU/g in samples T1, T2 and T3, respectively. Identification of isolates by 16s rRNA sequencing revealed that
I1 was Pseudomonas rhodesiae, I2 was Caulobacter henricii, I3 was Cupriavidus gilardii and I4 was
Phenylobacterium koreense. Individually Pseudomonas rhodesiae performed better than other isolates, however,
among all five consortia, best result was recorded for consortium D which showed exceptional growth from 3rd day
onward. In conclusion our results evidently showed that consortium D significantly survived in petroleum
contaminated soil samples. Sustained growth rate of bacteria is predictive of its effectiveness in breaking down
complex PHCs in more usable intermediates.
Petroleum hydrocarbon, Microbial remediation, Soil contamination, Bacterial consortia
Petroleum products are mixture of many different kinds of organic compounds, many of which are highly toxic, when spilled in environment can cause serious issues [1,2]. Waste oil is defined as any petroleum-based product that, through contamination, has become unsuitable for its original purpose due to the presence of impurities or loss of original properties. Waste oil is used oil containing not only breakdown products but also impurities from use. Some examples of waste oil are used oils such as hydraulic oil, transmission oil, brake fluids, motor oil, crankcase oil, gear box oil and synthetic oil [3]. Many of the same problems associated with natural petroleum exist with waste oil. When waste oil from vehicles drips out engines over streets and roads, the oil travels into the water table bringing with it such toxins as benzene. Contamination of soil by used lubricating oil is rapidly increasing due to global increase in the usage of petroleum products [4]. Bioremediation is an option that offers the possibility to destroy or render harmless various contaminants using natural biological activity. As such, it uses relatively low-cost, lowtechnology techniques, which generally have a high public acceptance and can often be carried out on site.
Soil is a privileged habitat for microorganisms and is the most biologically diverse environment [5]. Microorganisms are vital part of the environmental ecosystems, which could adjust energy flow and cycle of matter by disintegrating complex molecule in harmless intermediates. In soil they play an essential role in growth and development of agricultural crops, balance of the soil ecosystem, organic matter transfer and remediation. The diversity of the microbial community in soil is similarly related to the function and structure of its surroundings, it is one of the crucial components to maintain soil productivity.
Catabolic pathways operating in natural communities reflect interactions between microbial species under mixed culture conditions where extensive sharing of nutritional resources is common [6] and interaction of two or several strains is often a prerequisite for growth and biodegradation [7]. It has already been shown that a mixed culture of strains with different catabolic types overcomes incompatibilities in degradation of divergent substrate mixtures [8]. In this study we have attempted to identify individual isolates at local petroleum contaminated sites and prepare consortia to enhance degree of bioremediation.
Sample collection
Surface soil (0-5 cm depth) was collected from the areas within and surroundings of the Transport Nagar, Jaipur (T1: Surajpol Bazar Rd, Anaj Mandi, 26.916040 N, 75.846296 E, T2: Krishna Marketing, Lal Dungri, 26.914338 N, 75.849720 E and (T3: Vijay Path, Lal Dungri) 26.913570 N, 75.849307 E) from various automobile garages, fuelstorage tanks and at heavy vehicle station, these areas chronically exposed to small spills occurring during the day to day activity and uses of fuels, mainly of which are diesel (Figure 1). Control sample was collected from site completely isolated from roadways and not accessible to vehicles. Samples were air dried and pass through 2 mm sieve. The processed samples were store in sterile poly beg at room temperature for future testing.
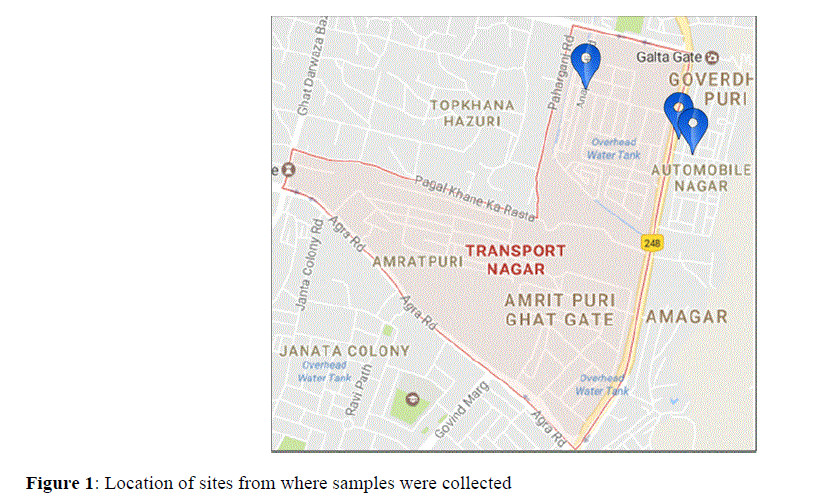
Figure 1: Location of sites from where samples were collected.
Microbial status of the soil sample by soil respiration method
To determine the microbial status 50 g of soil sample was weighed and mixed with tap water to bring moisture at 33% of water holding capacity (WHC). Later, 10 ml of freshly prepared N/10 NaOH solution was filled into in the two flasks, the mouth of test tubes were tied with a thread and the tubes were hanged in each flask. The mouth of flask was closed with rubber stopper and sealed with molten wax to make them air tight. Further, flasks were incubated at 25-30°C. Basal respiration was measured by monitoring CO2 evolution using NaOH to capture it. The NaOH was titrated by HCl 0.1 N as a result of microbial activity was absorbed in alkali in the test tubes [9].
Total heterotrophic bacterial population and petroleum degrading bacterial count
Population count was estimated by simple pour plate technique. Briefly, soil sample was collected from a field and was mixed thoroughly to make a composite sample for microbiological analysis. Therefore, 9 ml sterile water blanks were added in to seven sterile test tubes and arranged in a regular series. Further, 1g of soil sample was added into first in series of seven test tubes containing water blank to make 1:10 dilution. The dilution was vigorously agitated on a magnetic shaker for 20-30 min to obtain uniform suspension of microorganisms. After this, 1 ml of suspension from test tube containing 1:10 dilution was transferred into test tube arranged second in series of seven test tubes containing water blank with a sterile pipette under aseptic conditions to make 1:100 dilutions and it was mixed well for about 5 min. Similarly, the process of dilution was repeated further to reach the dilution of 10-7. Finally, 0.5 ml aliquot was inoculated in plates containing nutrient agar (Peptone, 5 g; Beef Extract, 3 g; NaCl, 3 g; and Agar, 18 g) (HiMedia, Mumbai, India) and inoculums was spread. All plates were incubated in an inverted position at 25°C for 2-3 days. Materials and methods were similar for petroleum degrading bacteria as above [10]. Accept for poured plates were incubated for 30 min at the room temperature so that inoculums absorb in medium then 0.5 ml of 2T oil (HiMedia, Mumbai, India) was spread over the surface of the medium in sterile condition. All plates were incubated at 35°C for 2-3 days.
Isolation of microorganisms
Soil suspension (Diluted up to 106 times) was prepared in sterile water. With the help of micro-pipette and glass spreader, 500 μl of the soil suspension was spread over the modified selective media (Nitrogen source either (NH4NO3, NH4Cl or NaNO3) 4.0 g; Na2HPO4, 2.0 g; KH2PO4, 0.53 g; K2SO4, 0.17 g, MgSO4, 7H2O, 0.10 g and 1 ml trace element solution (per 100 ml): EDTA, 0.1 g; ZnSO4, 0.042; MnSO4, 0.178 g; H3BO3, 0.05; NiCl, 0.1 g) (MSM) surface under LAF and the plates were incubated for 7 days at 37°C. Colonies on the plate were observed and the separated colonies were quarter streaked over the MSM surface and the plates were incubated further for 7 days at 37°C. After incubation period isolated colonies were observed and their purity was checked under the Binocular microscope (Olympus Corporation, Tokyo, Japan). These steps were repeated for many times until pure bacterial colonies were seen.
Colony characterization
After isolating the bacteria their colony morphology was compared with the chart (characterization chart) given below and by this their colony morphology was characterized [11].
Staining properties
Gram, spore and capsule staining properties were investigated to differentiate various cell wall constituents of isolates.
Determination of growth curve
Growth curve was determined using nutrient broth medium (HiMedia, Mumbai, India) and mineral salt broth medium (MSM) (HiMedia, Mumbai, India). Isolated bacteria were culture in two flasks containing both type of broth medium. The flasks were placed in the temperature controlled shaker that was adjusted at 150 rpm at 37°C for 24 h. Following incubation growth was measured by estimation of optical density (O.D.) in a spectrophotometer. A 2 ml of the broth culture was withdrawn at every one-hour intervals and O.D. was measured in spectrophotometer at 600 nm. Un-inoculated growth medium was treated as blank. Growth curve was prepared by plotting graph in terms of absorbance against time (h).
Identification using 16s RNA sequencing
DNA extraction
Bacterial Genomic DNA was isolated using the InstaGeneTM Matrix Genomic DNA isolation kit – As per the kit instruction below procedure followed. An isolated bacterial colony was picked and suspend in 1ml of sterile water in a microfuge tube. Centrifuge it for 1 min at 10,000-12,000 rpm to remove the supernatant. Add 200 μl of Insta Gene matrix to the pellet and incubate at 56°C for 15 min. Vortex at high speed for 10 s and place the tube in a 100°C in heat block or boiling water bath for 8 min. Finally, vortex the content at high speed for 10 s and Spin at 10,000-12,000 rpm for 2 min. In result, 20 μl of the supernatant was used per 50 μl PCR reaction.
Using below 16s rRNA Universal primers gene fragment was amplified using MJ Research Peltier Thermal Cycler. Forward and reverse primers name were 27F and 1492R for which sequence details were as, AGAGTTTGATCMTGGCTCAG and TACGGYTACCTTGTTACGACTT number of bases were 20 and 22 nucleotides. 1 μL of template DNA was added in 20 μL of PCR reaction solution. 27F/1492R primers were used for bacteria, and then PCR reaction performed with following conditions:
Initial denaturation 94°C for 2 min and then 35 amplification cycles at 94°C for 45 s, 55°Cfor 60 s and 72°C for 60 s. Final Extension at 72°Cfor 10 min. DNA fragments are amplified about 1,400 bp in the case of bacteria. Include a positive control (E. coli genomic DNA) and a negative control in the PCR.
Purification of PCR products
Unincorporated PCR primers and dNTPs were removed from PCR products by using Montage PCR Clean up kit (Millipore). The PCR product was sequenced using the 518F/800R primers. Sequencing reactions were performed using a ABI PRISM® BigDyeTM Terminator Cycle Sequencing Kits with AmpliTaq® DNA polymerase (FS enzyme) (Applied Biosystems).
Sequencing protocol
Single-pass sequencing was performed on each template using below 16s rRNA universal primers. The fluorescentlabeled fragments were purified from the unincorporated terminators with an ethanol precipitation protocol. The samples were resuspended in distilled water and subjected to electrophoresis in an ABI 3730xl sequencer (Applied Biosystems). Forward and reverse primers name were 785F and 907R for which sequence details were as, GGATTAGATACCCTGGTA and CCGTCAATTCMTTTRAGTTT number of bases were 18 and 20 nucleotides. Sequence data was aligned and analyzed for Identifying the Sample.
Bioinformatics protocol
The 16s RNA sequence was blast using NCBI blast similarity search tool. The phylogeny analysis of our sequence with the closely related sequence of blast results was performed followed by multiple sequence alignment. The program MUSCLE 3.7 was used for multiple alignments of sequences [12]. The resulting aligned sequences were cured using the program Gblocks 0.91b. This Gblocks eliminates poorly aligned positions and divergent regions (removes alignment noise) [13]. Finally, the program PhyML 3.0 aLRT was used for phylogeny analysis and HKY85 as Substitution model. PhyML was shown to be at least as accurate as other existing phylogeny programs using simulated data, while being one order of magnitude faster. PhyML was shown to be at least as accurate as other existing phylogeny programs using simulated data, while being one order of magnitude faster. The program Tree Dyn 198.3 was used for tree rendering [14].
Protein profiling of isolated bacteria
To compare the protein expression in the isolated bacteria, insoluble and soluble bacterial proteins were isolated and SDS-PAGE was done. For protein isolation 48 h incubated pure culture (at 37°C) was used to harvest the cells at 5,000 rpm for 10 min. The pellet was then resuspended in 150 μl of B-PER reagent [0.5 g Sodium chloride (NaCl) dissolved in 100 ml 20 mM Tris HCl (pH 7.5)] and again centrifuged at 13,000 rpm for 10 min at 4°C. Supernatant contains soluble proteins and pellet which was dissolved in Phosphate buffer saline (PBS) contains the insoluble proteins. Both types of proteins were then separated by Sodium Dodecyl Sulphate-Poly-Acryl amide gel electrophoresis (SDS-PAGE).
Degradation of PHC by individual isolates
A 100 ml MSM broth (HiMedia, Mumbai, India) was prepared in 500 ml conical flask. Then, 1 ml of 24 h bacterial culture (raised in nutrient broth medium (HiMedia, Mumbai, India) was inoculation in the MSM broth. Test tube containing N/10 NaOH was prepared and with the help of a thread and cork, hangs in flasks. The inoculated flask was placed in a shaker with controlled temperature adjusted at 80 rpm and at 37°C for 10 days. For growth analysis 2 ml of the broth culture was taken every day and O.D. was measured using a UV-VIS spectrophotometer at 600 nm, control blank was used to scale results. A curve was prepared by plotting absorbance against time (h). The N/10 NaOH was replaced with another fresh tube. Finally, the N/10 NaOH tube so obtained was titrated against N/10 HCl and CO2 evolved estimated as described earlier.
Degradation by bacterial consortia
Various bacteria consortia were prepared and grown in nutrient broth media (HiMedia, Mumbai, India). The 24 h culture of the bacterial consortia was inoculated in freshly prepared sterile MSM broth (HiMedia, Mumbai, India) supplemented with 2T engine oil (HiMedia, Mumbai, India). The inoculated flasks were incubated in shaker with controlled temperature at 150 rpm and 37°C for 10 days along with control blank. Optical densities of different consortia were observed daily at 600 nm on a UV-VIS spectrophotometer. Simultaneously number of bacteria in every consortium was estimated daily (Table 1).
| Consortium | Bacteria absent | Constituent bacteria |
|---|---|---|
| Consortium A | Nil | I1, I2, I3, I4 |
| Consortium B | I1 | I2, I3, I4 |
| Consortium C | I4 | I1, I2, I3 |
| Consortium D | I3 | I1, I2, I4 |
| Consortium E | I2 | I1, I3, I4 |
Table 1: Bacterial consortia were prepared by combining identified isolates
Optimization of growth conditions
Growths of the bacterial cultures were compared at different pH and temperature. Growth was observed in the form of O.D. at 600 nm. The pH of the medium was adjusted to (a) 6.0 (b) 7.0 (c) 8.0. The incubation temperature of the medium was adjusted to (a) 25°C (b) 37°C (c) 45°C. Bacterial growth under shaking conditions and thus effect of temperature was also studied. The inoculants at different condition were kept in incubator shaker at 150 rpm. Optical densities were obtained every day at 600 nm on UV-VIS spectrophotometer plotted against time on the X- axis.
To study the effect of shaking condition on hydrocarbon degradation, the bacterial cultures were grown in MSM broth containing 1% (v/v) 2T oil. For inoculation, bacterial cultures were raised over Nutrient broth medium till their O.D. reached to 0.3 at 600 nm. 1 ml of bacterial culture was then inoculated in MS broth medium. To observe the growth in shaking condition inoculated flask were kept into an incubator shaker at 150 rpm and 37°C temperature. O.D. of inoculations was taken at 600 nm every day up to 10 days.
Statistical evaluation
The mean values were compared using respective standard deviations followed by statistical comparisons between control and test samples for evaluation of significant changes in values by Student’s t-tests and Analysis of Variance test or ANOVA test. P<0.05 was considered as significant.
Microbial status versus soil respiration
It was observed that CO2 evolved in control soil sample was significantly higher than test samples (T1, T2 and T3). The amount of CO2 evolved at 10th day from control was 15.4 mg/kg, it gradually declined through 60th day and recorded as 8.43 mg/kg. Similarly, addition of Na2CO3 in control sample, although lowered the amount of CO2 evolved, but were higher than test samples (T1, T2 and T3). Both addition of 20 mg/kg and 40 mg/kg of Na2CO3 acted almost invariably on CO2 evolved. However, the amount of CO2 evolved in test samples, i.e., T1, T2 and T3 following addition of 20 mg/kg and 40 mg/kg of Na2CO3 indicated decline by 50% throughout the period of examination i.e. 10th day to 60th day. CO2 evolved in control samples following addition of 20 mg Na2CO3 at 10th day was measured as 1.76 mg/kg whereas following addition of 40 mg/kg Na2CO3 it was measured as 1.32 mg/kg. Furthermore, at 60th day following addition of 20 mg/kg Na2CO3 was 1 mg/kg, whereas, slightly increased following addition of 40 mg/kg Na2CO3, which was measured as 3.1 mg/kg (Figure 2).
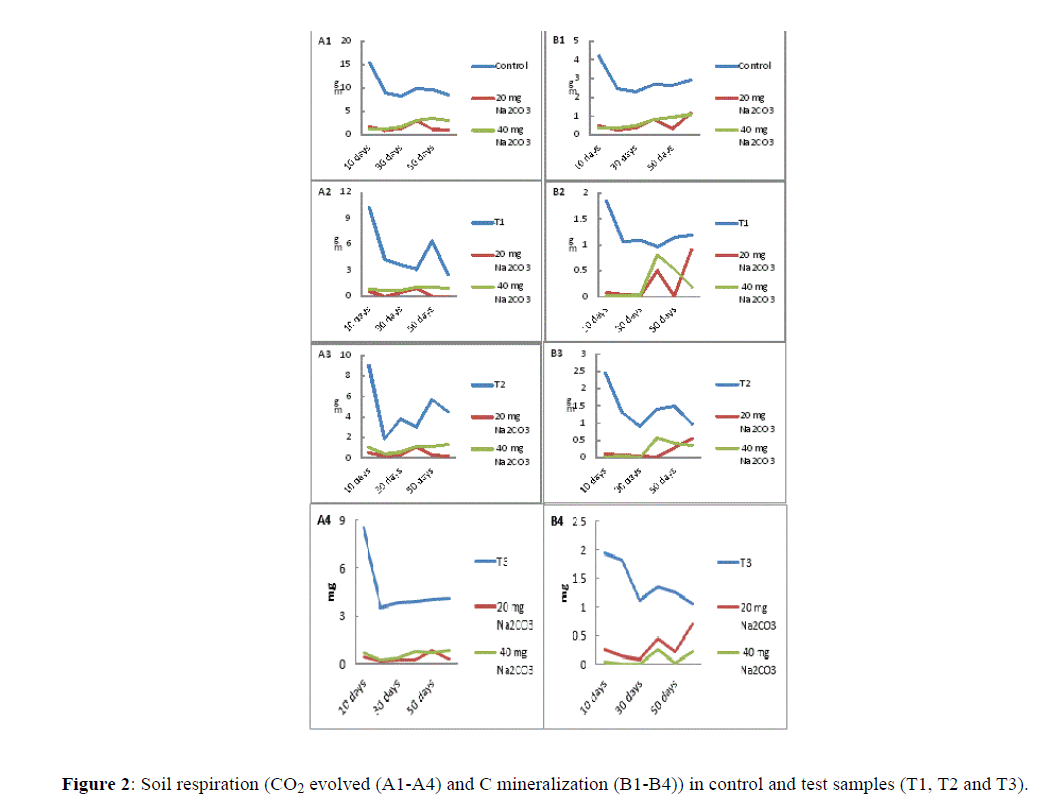
Figure 2: Soil respiration (CO2 evolved (A1-A4) and C mineralization (B1-B4)) in control and test samples (T1, T2 and T3)..
Enumeration of microorganisms from soil
Total heterotrophic bacterial counts (THBC) were conducted through serial dilution method (Table 2). In all dilutions of control sample counts were gradually increased as the day progressed. From 10th day to 60th day almost 9 fold increase was seen in control samples. Following addition of 20 mg/kg and 40 mg/kg Na2CO3 in control sample, bacterial growth changed substantially, at optimal dilution count were observed as 1.04 × 10⁸ CFU/g and 8.20 × 10⁷ CFU/g for 20 mg/kg and 40 mg/kg Na2CO3, respectively, on 10th day (Table 2). Remarkably, on 60th day counts rise substantially too many folds (Table 2).
| Days | Sample | 20 mg Na2CO3 | 40 mg Na2CO3 | |
|---|---|---|---|---|
| Â Â Â Â Â Â Â Â Â Â Â Â Â Â Â Â Â Control | 10 | 1.31 Ã 108 | 1.04 Ã 108 | 8.20 Ã 107 |
| 20 | 1.29 Ã 108 | 9.10 Ã 107 | 9.10 Ã 107 | |
| 30 | 1.37 Ã 108 | 1.92 Ã 108 | 2.90 Ã 108 | |
| 40 | 9.10 Ã 107 | 2.80 Ã 108 | 3.08 Ã 108 | |
| 50 | 3.33 Ã 108 | 7.60 Ã 107 | 9.80 Ã 107 | |
| 60 | 7.90 Ã 107 | 3.70 Ã 108 | 2.38 Ã 108 | |
| Â Â Â Â Â Â Â Â Â Â Â Â Â Â Â T1 | 10 | 1.55 Ã 108 | 1.32 Ã 108 | 1.20 Ã 108 |
| 20 | 1.61 Ã 108 | 1.38 Ã 108 | 1.20 Ã 108 | |
| 30 | 1.77 Ã 108 | 1.45 Ã 108 | 1.27 Ã 108 | |
| 40 | 1.71 Ã 108 | 1.45 Ã 108 | 1.29 Ã 108 | |
| 50 | 1.69 Ã 108 | 1.41 Ã 108 | 1.25 Ã 108 | |
| 60 | 1.65 Ã 108 | 1.38 Ã 108 | 1.22 Ã 108 | |
| Â Â Â Â Â Â Â Â Â Â Â Â Â Â Â Â Â Â Â Â Â Â Â Â Â T2 | 10 | 1.45 Ã 108 | 1.36 Ã 108 | 1.25 Ã 108 |
| 20 | 1.65 Ã 108 | 1.44 Ã 108 | 1.29 Ã 108 | |
| 30 | 1.70 Ã 108 | 1.48 Ã 108 | 1.31 Ã 108 | |
| 40 | 1.78 Ã 108 | 1.50 Ã 108 | 1.31 Ã 108 | |
| 50 | 1.72 Ã 108 | 1.45 Ã 108 | 1.30 Ã 108 | |
| 60 | 1.66 Ã 108 | 1.41 Ã 108 | 1.24 Ã 108 | |
| Â Â Â Â Â Â Â Â Â Â Â Â Â Â Â Â Â Â T3 | 10 | 1.61 Ã 108 | 1.55 Ã 108 | 1.20 Ã 108 |
| 20 | 1.71 Ã 108 | 1.52 Ã 108 | 1.27 Ã 108 | |
| 30 | 1.80 Ã 108 | 1.51 Ã 108 | 1.36 Ã 108 | |
| 40 | 1.83 Ã 108 | 1.56 Ã 108 | 1.39 Ã 108 | |
| 50 | 1.81 Ã 108 | 1.50 Ã 108 | 1.44 Ã 108 | |
| 60 | 1.79 Ã 108 | 1.45 Ã 108 | 1.40 Ã 108 |
Table 2: Total heterotrophic bacterial count in control and test samples (T1, T2 and T3) (Counts are in CFU/g).
Observation of growth in test samples, i.e., T1, T2 and T3, were significantly higher than control (P<0.05). Although numbers of counts were below 2 × 10⁸ CFU/g in all test samples, however, the growths were quite consistent throughout the duration of examination (Table 2). Effect of addition of 20 mg/kg and 40 mg/kg Na2CO3 on bacterial counts in test samples i.e. T1, T2 and T3 were comparatively non-significant (P=0.362). In all test samples (T1, T2 and T3) following addition of 20 mg/kg and 40 mg/kg Na2CO3 counts was close to 1.50 × 10⁸ CFU/g (Table 2).
Count of petroleum degrading bacteria (PDBC) in control sample, on 10th day was 2.83 × 10⁶ CFU/g, which increased further on 20th day to 3.31 × 10⁶ CFU/g. Afterward, count declined to 1.20 × 10⁵ CFU/g, 1.70 ×10⁵ CFU/g, 2.10 × 10⁵ CFU/g and 2.20 × 10⁵ CFU/g at 30th, 40th, 50th and 60th day, respectively. Variations in number of colonies were non-significant when compared with control (Table 3). In test samples i.e. T1, T2 and T3, counts were optimal at 10-4 dilution and recorded >300 in almost each day of examinations, i.e., 10th-60th day. At optimal dilution on 10th day 3.17 × 10⁶ CFU/g, 3.03 × 10⁶ CFU/g and 3.10 × 10⁶ CFU/g numbers of colonies were counted for T1, T2 and T3, respectively. For the same dilution on 60th day 3.91 × 10⁶ CFU/g, 3.82 × 10⁶ CFU/g and 3.50 × 10⁶ CFU/g, numbers of colonies were observed for T1, T2 and T3, respectively.
| Days | Sample | 20 mg Na2CO3 | 40 mg Na2CO3 | |
|---|---|---|---|---|
| Control | 10 | 2.83 Ã 106 | 2.15 Ã 106 | 2.07 Ã 106 |
| 20 | 3.31 Ã 106 | 3.42 Ã 106 | 3.47 Ã 106 | |
| 30 | 1.20 Ã 105 | 3.26 Ã 106 | 2.88 Ã 106 | |
| 40 | 1.75 Ã 106 | 2.91 Ã 106 | 3.08 Ã 106 | |
| 50 | 2.10 Ã 105 | 3.02 Ã 106 | 3.64 Ã 106 | |
| 60 | 2.20 Ã 105 | 1.24 Ã 106 | 1.84 Ã 106 | |
| T1 | 10 | 3.17 Ã 106 | 2.06 Ã 106 | 1.65 Ã 106 |
| 20 | 3.53 Ã 106 | 2.19 Ã 106 | 1.73 Ã 106 | |
| 30 | 3.60 Ã 106 | 2.21 Ã 106 | 1.75 Ã 106 | |
| 40 | 3.74 Ã 106 | 2.26 Ã 106 | 1.79 Ã 106 | |
| 50 | 3.85 Ã 106 | 2.33 Ã 106 | 1.75 Ã 106 | |
| 60 | 3.91 Ã 106 | 2.36 Ã 106 | 1.72 Ã 106 | |
| T2 | 10 | 3.03 Ã 106 | 1.98 Ã 106 | 1.70 Ã 106 |
| 20 | 3.19 Ã 106 | 2.17 Ã 106 | 1.72 Ã 106 | |
| 30 | 3.41 Ã 106 | 2.25 Ã 106 | 1.75 Ã 106 | |
| 40 | 3.78 Ã 106 | 2.27 Ã 106 | 1.80 Ã 106 | |
| 50 | 3.79 Ã 106 | 2.35 Ã 106 | 1.82 Ã 106 | |
| 60 | 3.82 Ã 106 | 2.40 Ã 106 | 1.80 Ã 106 | |
| T3 | 10 | 3.10 Ã 106 | 2.00 Ã 106 | 1.66 Ã 106 |
| 20 | 3.15 Ã 106 | 2.05 Ã 106 | 1.69 Ã 106 | |
| 30 | 3.22 Ã 106 | 2.15 Ã 106 | 1.72 Ã 106 | |
| 40 | 3.34 Ã 106 | 2.22 Ã 106 | 1.75 Ã 106 | |
| 50 | 3.50 Ã 106 | 2.34 Ã 106 | 1.79 Ã 106 | |
| 60 | 3.50 Ã 106 | 2.31 Ã 106 | 1.81 Ã 106 |
Table 3: Total petroleum degrading bacterial count in control and test samples (T1, T2 and T3) (Counts are in CFU/g)
Addition of Na2CO3 in control and the test sample showed significant reduction (P<0.05) in numbers of colonies, however, close to 2.00 × 10⁶ CFU/g colonies were observed in test samples, i.e., T1, T2 and T3 added with 20 mg/kg Na2CO3 and nearly 1.75 × 10⁶ CFU/g colonies in test samples (i.e., T1, T2 and T3) added with 40 mg/kg Na2CO3. These numbers were significantly lower than colonies observed in control samples added with 20 mg/kg Na2CO3 and 40 mg/kg Na2CO3. At 60th day at 10-4 dilution 2.15 × 10⁶ CFU/g and 2.07 × 10⁶ CFU/g colonies were observed in control sample added with 20 mg/kg Na2CO3 and 40 mg/kg Na2CO3, respectively. Whereas on 60th day the numbers fall to 1.23 × 10⁶ CFU/g and 1.83 × 10⁶ CFU/g for control sample added with 20 mg/kg Na2CO3 and 40 mg/kg Na2CO3, respectively (Table 3). Optimal growths in control and test samples were found at 30th-40th day.
From the growth pattern it was evident that from 30th onward there was a sharp decline in growth of both heterotrophic and petroleum degrading bacteria in control sample, whereas, in test samples, i.e., T1, T2 and T3, both heterotrophic and petroleum degrading bacteria show higher and more stable growth comparing to control sample (Table 3).
Isolation of microorganisms and colony characterization
Bacterial isolation was performed by spread plate technique, result showed formation circular form, Elevation pulvinate with reverse side ,beige colorless, irregular, umbonate whitish-yellowish colonies throughout the plate containing MSM (Table 4). Isolated bacterial colonies with specific characteristics were further named according to their defined colony morphology as I1, I2, I3 and I4. Table 4 shows specific colony morphology and their abbreviations. Microscopic examination of isolated colonies revealed that all distinct colonies were gram negative bacterium. I2 and I4 were flagellar bacterium with distinct motility. I1 were non-spore forming bacteria (Table 4).
| Isolate Number | Colony Morphology | Microscopy | Gram Staining | Spore Staining | Capsule staining |
|---|---|---|---|---|---|
| I1 | Whitish colony, circular form, Elevation pulvinate with reverse side, beige colourless, well developed margins is entire. | Rod shaped | Negative | Negative | Negative |
| I2 | Light yellowish in colour, irregular form, elevation umbonate, margins are irregular and undulate. | Rod shaped, flagellar | Negative | Negative | Negative |
| I3 | White in colour, irregular form, elevation-umbonate, well developed and margins are undulate. | Rod shaped | Negative | Negative | Negative |
| I4 | White in colour, irregular (spreaded) form; elevation umbonate, reverse side being white in colour, lobate margins in zigzag chain like fashion. | Rod shaped, motile, flagellar | Negative | Negative | Positive |
Table 4: Colony morphology and microscopical characteristic of isolates
Growth curve of isolates
Growth curve of isolates were analyzed in nutrient agar and MSM media, for which growth curves are shown in Figure 3. Among all isolates I2 and I3 represented perfect growth pattern in nutrient agar media. Between 6th-10th hour of incubation, log and stationary phase were recorded for all isolates in nutrient media. Growth of isolate I1 was significantly lower than isolates I2 and I3, however, growth of I4 was parallel to I1. Growth of I4 was optimal during 5th -7th hour of incubation, which flattened quickly and jumped back again at 24th hour (Figure 3A).
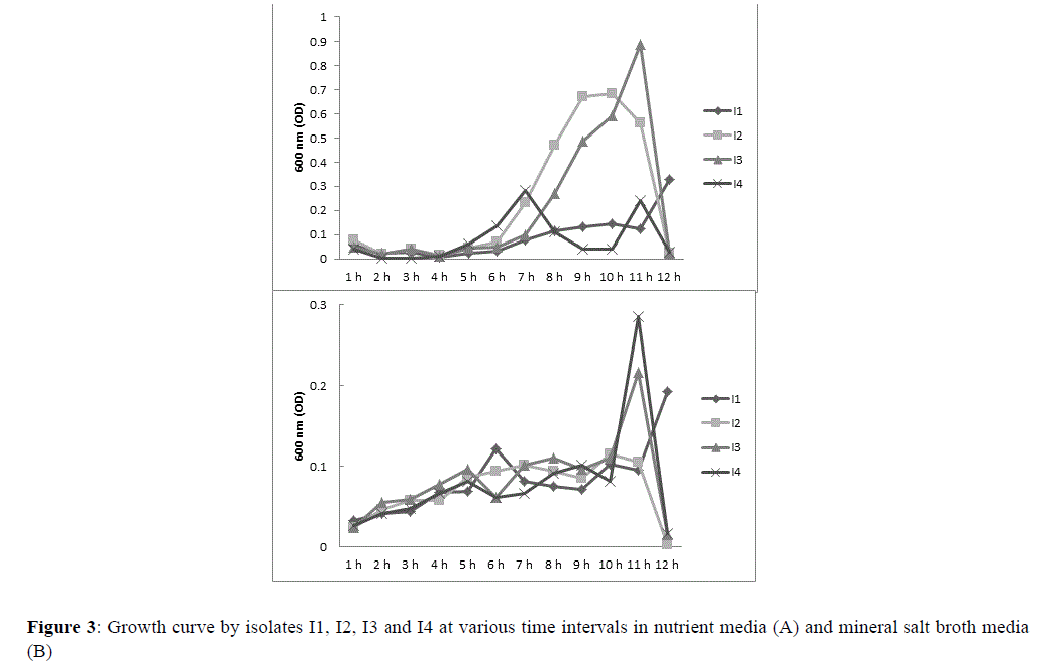
Figure 3 Growth curve by isolates I1, I2, I3 and I4 at various time intervals in nutrient media (A) and mineral salt broth media (B).
Growth in mineral salt broth media show slightly restrained growth pattern than nutrient agar media. Figure 3B shows that until 9th hour of incubation growth of isolates were only sedimentary. Growth of isolates suddenly jump to about 20-30 folds after 10th hour of incubation. Isolates I3 and I4 showed comparatively higher level of growth, for which absorbance were noted as 0.2 and 0.3. Isolate I1 however, delayed its response for 24 h before it jumped to absorbance 0.2. Isolate I2 response in MSM was lower than other isolates; nevertheless, its response was typical. Highest absorbance for I2 was recovered at 9th hour (Figure 3B).
Identification of isolates
Identification of isolates by 16s rRNA sequencing revealed that I1 was Pseudomonas rhodesiae, I2 was Caulobacter henricii, I3 was Cupriavidus gilardii and I4 was Phenylobacterium koreense. Through internal primers 785F and 907R, it was evident that I1 contains 926 nucleotides and 940 nucleotides for 785F and 907R, respectively. Whereas, for I2, 993 nucleotides and 896 nucleotides for 785F and 907R, respectively. Likewise, for I3 it was noted as 913 nucleotides and 770 nucleotides for 785F and 907R, respectively. Similarly, for I4 it was 973 nucleotides and 906 nucleotides for 785F and 907R, respectively.
Protein profiling
The electrophoretic patterns of whole cell soluble proteins of the isolates were visualized on SDS gels. It was found that there were patterns of homogenity between the strains were very distinct. The P. rhodesiae, C. henricii, C. gilardii and P. koreense, were identified by the 16s rRNA identification were also assayed by the SDS-PAGE technique. The results indicated that from the two approaches yielded the same species identification (Figure 4). In addition, by comparison of SDS-PAGE patterns of all four strains was completely dissimilar.
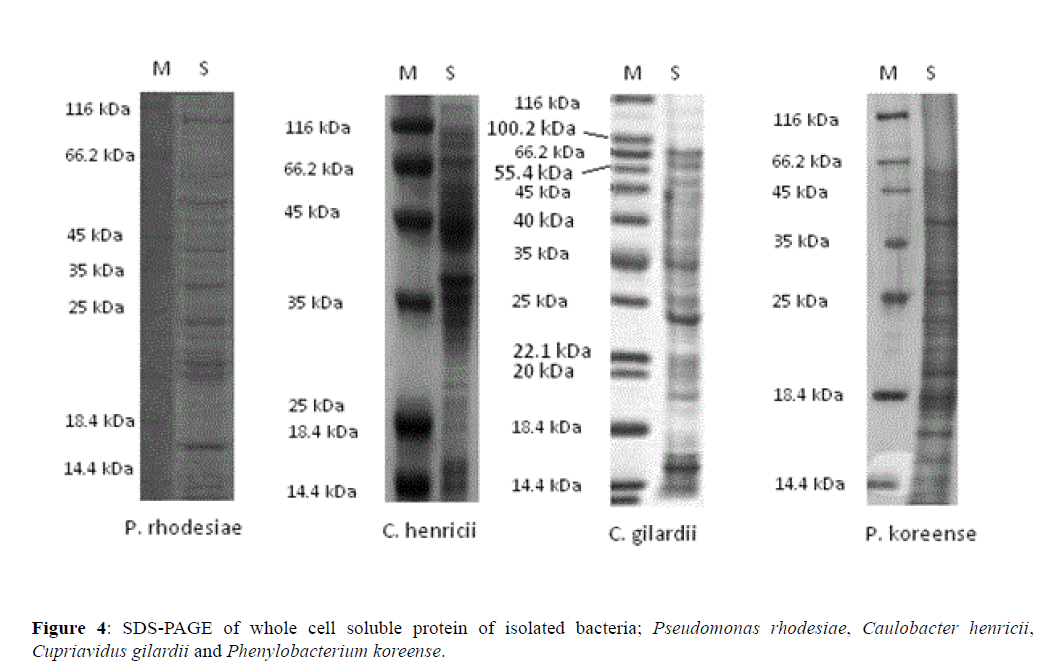
Figure 4 SDS-PAGE of whole cell soluble protein of isolated bacteria; Pseudomonas rhodesiae, Caulobacter henricii, Cupriavidus gilardii and Phenylobacterium koreense.
In P. rhodesiae 10 distinct bands were observed at nearly about 115 kDa, 60 kDa, 50 kDa, 48 kDa, 40 kDa, 30 kDa, 23 kDa, 21 kDa, 20 kDa and 16 kDa. Similarly, for C. henricii a total of 8 distinct bands were observed at 114 kDa, 113 kDa, 66 kDa, 44 kDa, 37 kDa, 36 kDa, 15 kDa and 14 kDa. Likewise, for C. gilardii, 9 obvious bands were recorded at nearly about 66.2 kDa, 56 kDa, 46 kDa, 35 kDa, 25 kDa, 23 kDa, 22 kDa, 20 kDa and 16 kDa. Whereas, for P. koreense, 10 distinct bands were observed at 50 kDa, 46 kDa, 45 kDa, 40 kDa, 30 kDa, 28 kDa, 25 kDa, 20 kDa, 18 kDa and 17 kDa.
From the results it was obvious that between P. rhodesiae and P. koreense highest number of similar size bands were observed; such as bands at 50 kDa, 40 kDa, 30 kDa and 20 kDa. Whereas, between C. gilardii and P. koreense at least three bands were found similar in size, such as; 46 kDa, 25 kDa and 20 kDa (Figure 4).
Petroleum degradation capacity of individual bacterial isolates
Individual isolates, i.e., I1, I2, I3 and I4 were examined for degradation of petroleum hydrocarbons and respective CO2 generation. Result showed that during period of investigation (10 days), degradation assumed from 4th day of incubation among all isolates. The selective media only allowed bacterium to grow which can sufficiently breakdown petroleum hydrocarbons. It was evident from the result that I4 was most effective in degrading petroleum hydrocarbons comparing to other isolates.
Individual isolates, i.e., I1, I2, I3 and I4 were examined for degradation of petroleum hydrocarbons and respective CO2 generation. Result showed that during period of investigation (10 days), degradation assumed from 4th day of incubation among all isolates. The selective media only allowed bacterium to grow which can sufficiently breakdown petroleum hydrocarbons. It was evident from the result that I4 was most effective in degrading petroleum hydrocarbons comparing to other isolates.
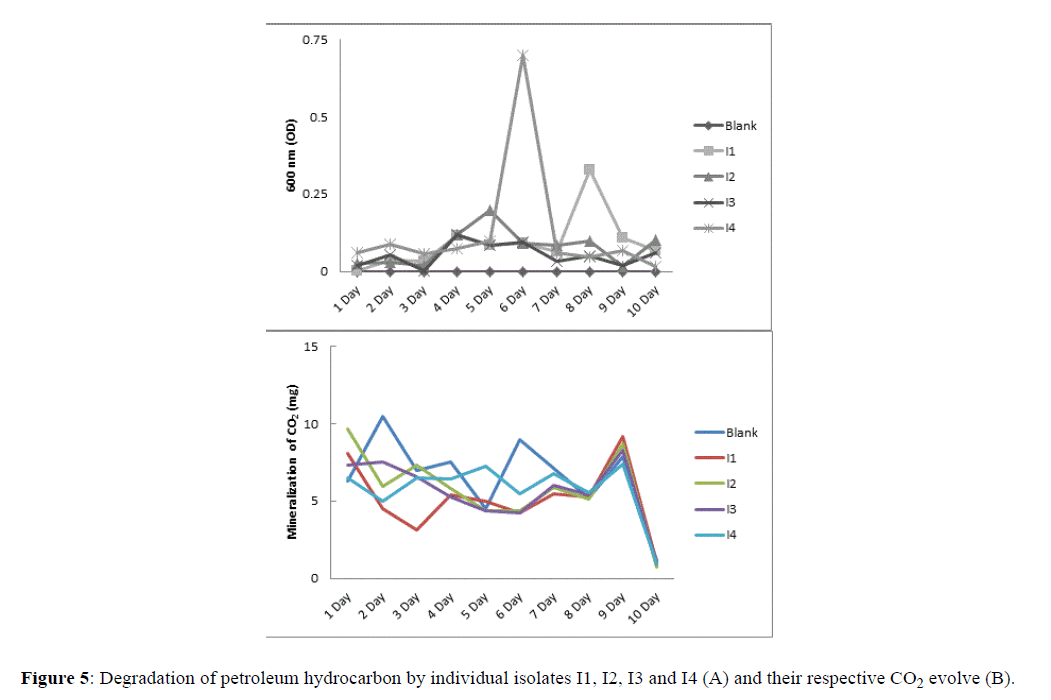
Figure 5:Degradation of petroleum hydrocarbon by individual isolates I1, I2, I3 and I4 (A) and their respective CO2 evolve (B).
Similarly, generation of CO2 was higher in media incubated with I4 among all isolates, however, lower than blank. Optimal CO2 generation in I4 was observed at 5th day of incubation, however, a sharp decline was observed following 9th day incubation. Other isolates, i.e., I1, I2 and I3 showed lenient generation of CO2, although eventually rise at the 9th day of examination. Isolates I1, I2 and I3 along with blank behaved equally from 8th onward of examination (Figure 5B).
Degradation of petroleum hydrocarbon by bacterial consortia
A total of five different consortia were used to evaluate degradation of petroleum, contaminant from soil. These were consortia A-E, consortia A contained all four isolates, whereas, consortia B-E and each lack one isolate, i.e., I1, I4, I3 and I2, respectively.
Result showed that following inoculation with various consortia significant changes in level of degradation was observed. The best result was recorded for consortium D which showed exceptional growth from 3rd day onward. At 10th day of incubation growth of consortium D reached highest peak which was nearly 2-3 folds greater than other consortia. Besides consortium D, consortium C showed a constant growth throughout the period of examination. Consortia B and C responded equally which grew constantly until 5th day of incubation, however, declined sharply following 6th day of incubation. Consortium A with highest number of isolates showed weakest response as the growth was only momentarily and sharply declined from 4th day onwards. However, it is to be noted that the peak of growth in consortium A was very close to that of consortium D (Figures 6A and 6B).
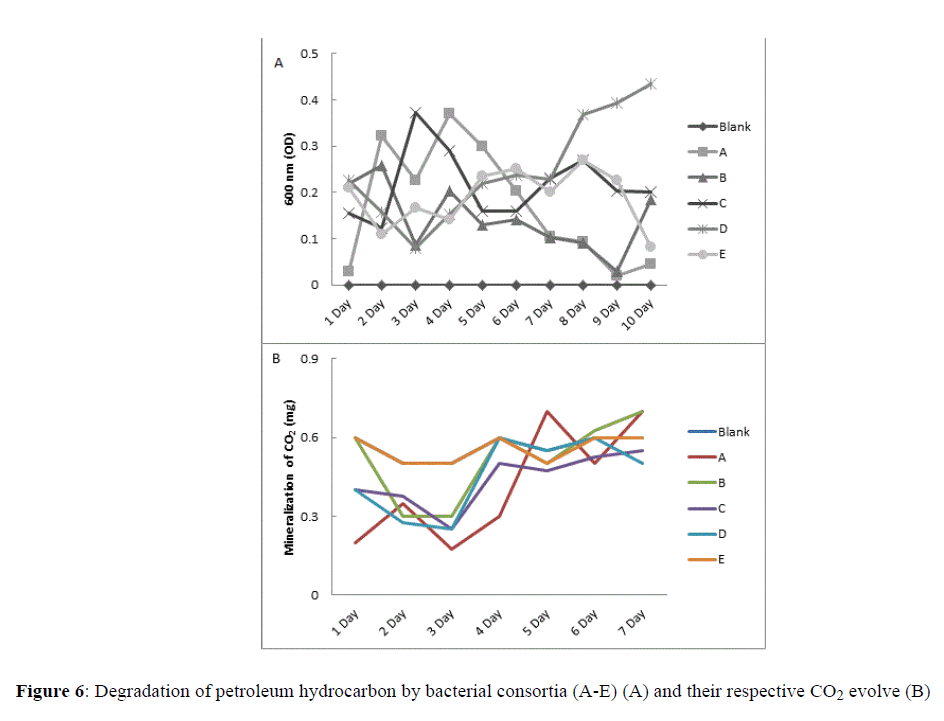
Figure 6:Degradation of petroleum hydrocarbon by bacterial consortia (A-E) (A) and their respective CO2 evolve (B).
Level of CO2 evolved by each consortia was measured, result showed similar pattern in all consortia. However, highest level of CO2 evolved was noted in consortia A and B. In all consortia, i.e., A-E from 3rd day onward showed gradual increase in generation of CO2.
Optimization of growth of isolate
Optimization of growth of isolates, i.e., I1, I2, I3 and I4 by changing condition such as pH and temperature was evaluated (Figure 7). Result showed that best growth with prolonged log phase and stationary phase was found at pH 8 and at 37°C. Both temperature 45°C and 25°C were not able to optimize growth rate. Similarly, both pH 6 and pH 7 were not supplementary to raise the level of growth in any isolate comparing to pH 8. It was obvious from the significant rise in absorbance of microbial growth that at pH 8 and at 37°C temperature all isolates, i.e., I1, I2, I3 and I4 grow better (Figure 7).
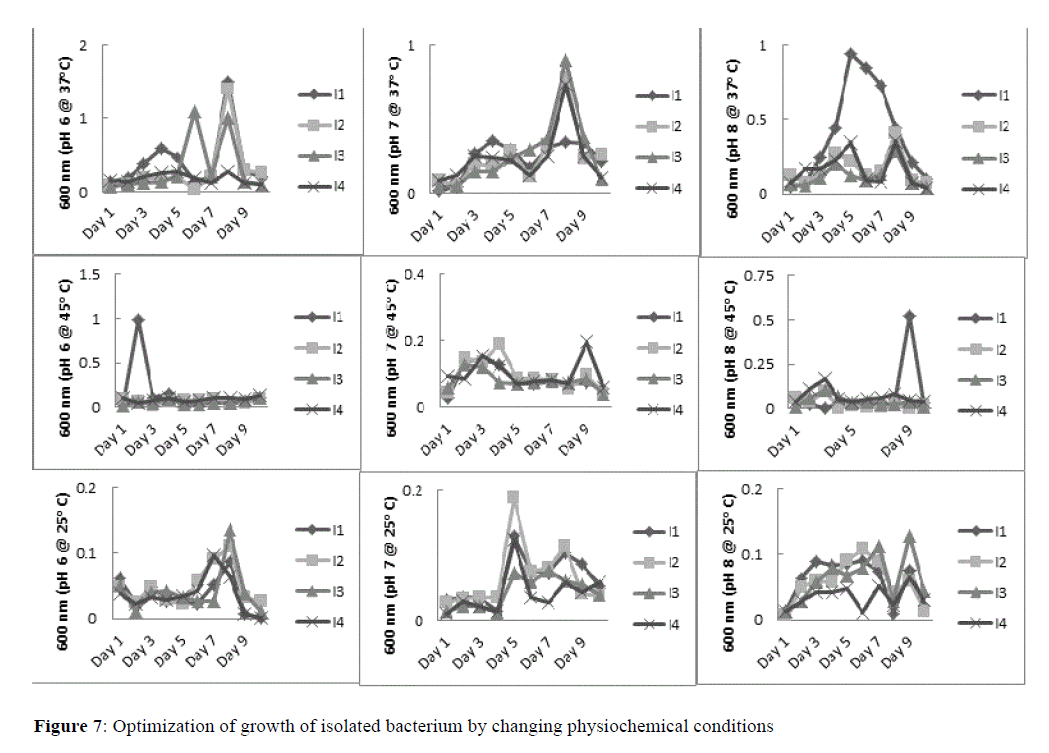
Figure 7:Optimization of growth of isolated bacterium by changing physiochemical conditions.
With rapid development of industry, automobiles, and airplanes, the demand for petroleum is exponentially expanded. The automobile activities usually involve changing of lubricating oil, servicing and greasing of motor parts and replacement of worn-out parts [15] in the motor transport workshop. The disposal of spent lubricating oil other wastes used in cleansing during auto-mobile servicing pollute the soil and once these waste materials enter the soil they become part of the biological cycle that affects all forms of life [16]. Pollution caused by petroleum and its derivatives is the most prevalent problem in the environment [17]. Petroleum hydrocarbons (PHCs) are constituents of engine fuels, industrial solvents and many other products and are the most widespread among the organic contaminants due to extensive current use of oil and petroleum products throughout the world.
The soil is the largest terrestrial carbon (C) pool [18]. Soil respiration refers to the production of carbon dioxide when soil organisms respire. This includes respiration of plant roots, the rhizosphere, microbes and fauna. Our study shows that level CO2 released was lower in all test samples comparing to control during whole period of investigation, this could be due to absence and/or limited presence of oxidizable organic substrate. A recent study by Wolińska et al. [19], provides valuable information on soil respiration following artificial contamination by new oil, waste oil, petrol and diesel. According to this study three different amount of contaminants were used to investigate level of respiration. Except for petrol all three petroleum product showed increased respiration when compared to control. However, an exponential decrease was observed with increasing amount of contaminants. Petrol on the other hand showed a sharp decline in release of CO2 [19]. As per our results for CO2 evolved it is quite obvious that in both cases either petrol or diesel spillage on the site have reduced respiration substantially comparing to control. As most of the heavy vehicle in India run on diesel we could have expected a rise in respiration but since we know from Wolińska et al. [19], study that a gradual increase in amount if diesel will eventually reduce respiration. Therefore, a higher amount of spillage is predicted from our study in all three sites, nevertheless, contamination by petrol cannot be ruled out completely.
Many bacteria consume petroleum contaminants for their survival, therefore breakdown complex chemical compounds in to non-toxic intermediates. The recognition of biodegraded petroleum-derived aromatic hydrocarbons in marine sediments was reported by Jones et al. [20]. The microorganisms, namely, Arthrobacter, Burkholderia, Mycobacterium, Pseudomonas, Sphingomonas and Rhodococcus were found to be involved for alkylaromatic degradation. Bacteria are the most active agents in petroleum degradation, and they work as primary degraders of spilled oil in environment [21,22]. Several bacteria are even known to feed exclusively on hydrocarbons [23]. We investigated population of heterotrophic and petroleum degrading bacteria in the samples collected from Surajpol Bazar Rd, Anaj Mandi; Krishna Marketing, Lal Dungri and Vijay path, Lal Dungri of Jaipur suburb. Our result indicated no to slight change in numbers of heterotrophic bacterial colonies in all test samples and control sample. The unaltered growth in test samples and control can be assumed due to selective growth. The strain/species of bacteria may vary significantly from one sample to another. Interestingly, following 30 days of investigation a gradual decline in count was observed. This sharp decline could be related to exhausted organic substrate following 30th day. There were no evidences present to compliment this claim therefore more work is required to ascertain this statement.
Similarly, petroleum degrading bacterial count revealed that it grew by about two-folds in test samples comparing to control. It was however, obvious to have an increase in petroleum degrading bacteria as these were petroleum contaminated sites. It also confirms that the petroleum hydrocarbons were in abundance at these sites. It was notable that the growth of PDB was constant throughout the period of investigation whereas, a sharp decline was observed in control sample following 30th day of investigation.
The 16s rRNA identification and through bioinformatics tool our study exclusively revealed that four isolates grow efficiently in the soil samples collected for this study, which were further identified as, Pseudomonas rhodesiae, Caulobacter henricii, Phenylobacterium koreense and Cupriavidus gilardii. All four isolates were found associated with petroleum degrading ability. These results were later reconfirmed by protein profiling. Our results clearly showed that protein expression of isolated bacteria substantially differed, although there were few bands which were of same size found in some of the isolates.
Biodegradation by natural populations of microorganisms represents one of the primary mechanisms by which petroleum and other hydrocarbon pollutants can be removed from the environment [24] and is cheaper than other remediation technologies [25] Most of these bacteria belong to the genera Pseudomonas, Rhodococcus, Paenibacillus, Acinetobacter, Bacillus and Mycobacterium [26-31]. In our study we found that all four isolates, i.e., Pseudomonas rhodesiae, Caulobacter henricii, Phenylobacterium koreense and Cupriavidus gilardii were able to breakdown complex petroleum hydrocarbons, individually. Results showed that 4th day onward PAH degradation starts and continue till 10th day of investigation. However, individually their ability to degrade PAHs varied greatly. Such as; Cupriavidus gilardii on 6th day highest growth, similarly, Pseudomonas rhodesiae at 8th day noted with highest growth, Caulobacter henricii showed maximum growth on 5th day of incubation. Lowest ability among all isolates to degrade PAHs was found by Phenylobacterium koreense. Earlier studies have been found in agreement with our results. A study by Patowary et al. [32], reported that an efficient biosurfactant-producing/hydrocarbondegrading native bacterial strain Pseudomonas aeruginosa KS3 was isolated from crude oil contaminated soil. Experiments were conducted in the laboratory to determine the efficiency of strain KS3 to degrade polycyclic aromatic hydrocarbons (PAHs).
Some bacteria perform better in consortium perhaps the limited ability of the above two isolates rise when incubated with varieties of other bacteria with similar abilities. A microbial consortium can be endosymbiotic or ectosymbiotic. Our study used the isolated bacteria to form five different consortia for evaluation of efficiency to degrade petroleum hydrocarbon. Our result showed that consortium D was best in degrading petroleum hydrocarbons as it has most stable and highest growth rate. Consortium D was composed of Pseudomonas rhodesiae, Caulobacter henricii and Cupriavidus gilardii. We have already mentioned above that Pseudomonas rhodesiae and Cupriavidus gilardii were best in degrading PAH’s individually. Therefore, success of consortium D was predictable. However, it was interesting to note that consortium E also consisted of Pseudomonas rhodesiae and Cupriavidus gilardii but the growth was limited and for short span. The only difference these two consortia had was Caulobacter henricii which was in consortium D and Phenylobacterium koreense which was in consortium E along with other two best performing bacteria i.e. Pseudomonas rhodesiae and Cupriavidus gilardii. It could be easily speculated that Phenylobacterium koreense was perhaps not symbiotic to Pseudomonas rhodesiae and Cupriavidus gilardii, therefore, a quick drop in growth rate. However, more work is required to ascertain this statement.
Our study also revealed that consortia A also contained both Pseudomonas rhodesiae and Cupriavidus gilardii but did not perform well. The growth elevated initially from 3rd day 5th day but declined sharply in following days. This consortium had two more members, i.e., Caulobacter henricii and Phenylobacterium koreense. It was therefore concluded that Pseudomonas rhodesiae is a strong candidate in managing endosymbiosis between isolates as consortium C which despite presence of Caulobacter henricii and Phenylobacterium koreense grew substantially better than consortium B.
These conditions are pH and temperature, Jaipur, is a city of India lies on a borderline between a hot desert climate and a hot semi-arid climate under the Köppen climate classification "BWh/BSh", (Google Maps). It was important therefore that these exclusively identified isolates must be examined for their optimal growth. An optimization of environmental condition was therefore applied to these isolates to examine its enhanced activity. Our result for optimization revealed that best growth with highest log phase and stationary phase was observed in media of pH 8 at 37°C for all four isolates, i.e., Pseudomonas rhodesiae, Caulobacter henricii, Phenylobacterium koreense and Cupriavidus gilardii. Our results was found in accordance with earlier studies which claimed that the highest degradation rates that generally occur in the range 30-40°C in soil environments [33,34]. Our result for optimal pH was also found in close agreement with study conducted by Pawar [35]. Pawar reported that pH 7.5 was most suitable for the degradation of all PAHs as 50% degradation was also observed for all in soil pH 7.5 within the first seven days.
In conclusion our results showed that consortium D was a completely usable and functional bioremediation tool to improve soil physiochemical characteristics and with effective bio-degradation of petroleum hydrocarbon. Our study also evidently establishes that Pseudomonas rhodesiae individually was better in degrading PAH’s than other isolates.
The work at our lab is financially support by the Maulana Azad Education Foundation (MAEF), Ministry of Minority Affairs, Govt. of India, New Delhi, India.