Research Article - Journal of Natural Product and Plant Resources ( 2017) Volume 7, Issue 2
Compound 1 and 2 were isolated as a yellow needle by repeated column chromatography on silica gel 60 F254 and subsequent repeated gel filtration on sephadex LH20 from the n – butanol portion of V. doniana. Their structures were established mainly by FTIR, FABMS, High resolution (1Dand 2D) spectroscopic and chemical analysis. They are hence determined as 3 – O– [α – L – rhamnopyranosyl – ( 1→6) – β – D – glucopyranosyl] – 7 – O – (β – D- glucopyranosyl) – (quercetin) and 3-O –β-glucosyl-(1→2)- β-glucoside-7-O- β-glucosyl-(1→4) –α-rhamnoside- (myricetin)
Vitex doniana, Quercetin, Myricetin verbenaceae, High resolution (1D and 2D).
Phytochemicals are biological active compounds in plants used for food and medicines. Plant natural products are involved in many aspects of human existence. These natural products may be used as purified compounds or as components of complex mixtures which serve as medicines, pesticides, flavorings, herbicides, etc. Family Verbenaceae is one of the largest families in the plant kingdom known to be rich in medicinal plants. Many species of this family had medicinal values and are used in folk medicine. Flavonoids are termed as polyphenols of plant origin that are the most important compounds in human diet due to their wide spread distribution in foods and beverages. They can occur both in human, in the free form (aglycones), as glycosides and differ in their substituent (type, number and positive) and in their unsaturation.
Flavonoids are known to be associated with reduced risk for certain chronic diseases [1]. These include the prevention of cardiovascular disorder [2] and other kinds of cancerous processes [3]. Flavonoids exhibit antiviral properties [4], anti-microbial [5], anti-inflammatory activities [6], anti-ulcer [7] and anti-allergic properties [8]. Flavonoids are mostly found in fruits [9], vegetables and cereals [10]. The role of flavonoids in biological system appears yet to be far from definitively determined, involving a large number of research groups all over the world. In fact, many new actions of flavonoids in vivo have been put forward, the previously actions are never dismissed, only relegated to secondary ways of flavonoids action, usually considered to be important in pathological conditions [11].
Vitex doniana (Black plum), is a deciduous tree with a heavy rounded crown; it usually grows up to 20 meters tall with some reaching 25 meters [12]. This is a very useful, multi-purpose tree providing food, medicine and materials. The fruit can become a stable food during the raining season. The fruit is use to improve fertility and to treat anemia, jaundices, leprosy and dysentery [13] both the dried and fresh fruits are eaten as a treatment against diarrhea [14,15]. The powdered bark is added to water and then taken to treat colic [16]. The bark extract is used to treat stomach complain, kidney troubles, leprosy, liver diseases, and control bleeding after child birth. We reported here in this paper the isolation and structural elucidation of two flavonoid glycosides from the flower of Vitex doniana.
Experiment
General experimental procedure: All melting points (mp) were determined on Gallenkamp melting point apparatus and results are uncorrected. All solvents of analytical grade were purchase from BDH chemical Ltd. Poole England. TLC analysis was carried out using cellulose (TLC) and Silica gel 60 F254 (TLC) plates (Merck, Darmstadt, Germany). Polyamide (Roth, England) and Sephadex LH20 (Fluka, Switzerland) were used for open column chromatography (Cc). Chromatographic system: TLC:n-BuOH:HOAC:H2O (4:1:5 V/V/V) Upper phase, HOAC:HCl Conc:H2O (30:3:10 V/V/V), n-BuOH:pyridine:H2O (6:4:3 V/V/V) and EtOAC:HCOOH:H2O (18:1:1:V/V/V) were used as solvent system for sugars. Visualization of the plate were performed using visible light U.V fluorescence and or spraying with the following reagent i=2% AlCl3, ii=10% H2SO4, iii=Aniline phthalate by heating at 110°C for 5-10 min for sugars. Column chromatography (Cc): Chloroform, Chloroform/Ethylacetate mixture, Ethylacetate, Ethylacetate/methanol and methanol 100% was used base on increasing gradient polarity system.
Acid hydrolysis
Compounds (1 and 2) were treated with 10 mg and refluxed with 5% H2SO4 for 2 h. UV spectra were recorded on specord 40 UV-VIS spectrophotometer (Jena Analytik AG Germany) and FAB-MS was measured on a mass Autospec-ultima-TOF spectrometer. 1H NMR and 13C NMR experiments were performed on Bruker spectrometer 400 MHZ for 1H and 125 MHZ for 13C NMR. Spectra were referenced to the CD3OD solvent, signals at δ3.30 (`H) and 49.00 (13C) with TMS as an internal solvent standard. Chemical shift-values (δ) were reported in parts per million (ppm) in relation to the appropriate internal solvent standard (TMS). The coupling constants (J-values) were given in Hertz-TOF spectrometer.
Plant material
Flowers of V. doniana (Verbenaceae) were collected from a farmland in Basawa, a village outskirt of Zaria in Kaduna State of Nigeria in the month of October, 2014. Botanical identification was performed at the herbarium section of the Department of biological science, Ahmadu Bello University, Zaria, Nigeria and voucher No. DC.14904 was obtained.
Extraction and Isolation
The air dried portion of the flower was made into finely powdered material using clean pestle and mortar. The powdered material (1.20 kg) was exhaustively extracted at room temperature using n-hexane (5 × 700 ml). The filtrate was reconstituted using rotary evaporator while the marc was dried at room and re-extracted with methanol (5 × 600 ml) exhaustively. The methanol extract was re-constituted using rotary evaporator to afford a solid gummy mass. The methanol extract was dissolve in water and partitioned with Diethyl ether using separatory funnel.
The aqueous partitioned portion was further subjected to another partitioning procedure using n-Butanol (solvent of increasing polarity). The n-butanol from the partition portion above was further partitioned exhaustively with 1% KOH portion. The KOH portion obtain was further partition with HCl/n-butanol (1:1) to obtained n-butanol and HCl portion. The n-butanol portion containing the crude flavonoids was subjected to column chromatography to obtain a total of 70 fractions of 10 ml aliquot. Similar fractions were pooled together base on their TLC profile to afford 4 major fractions of A1=1-12, A2=13-26, A3=27-63 A4=64-70. Fraction A3=(27-63) consisting of two major spots with wide Rf value of 0.40 and 0.65 was obtain, this was further subjected to a repeated gel filtration technique using sephadex LH20 and eluted with methanol 100% to afford compound 1 and 2 with distinct homogeneous single spot. Attached below is the extraction and isolation procedure (Figure 1).
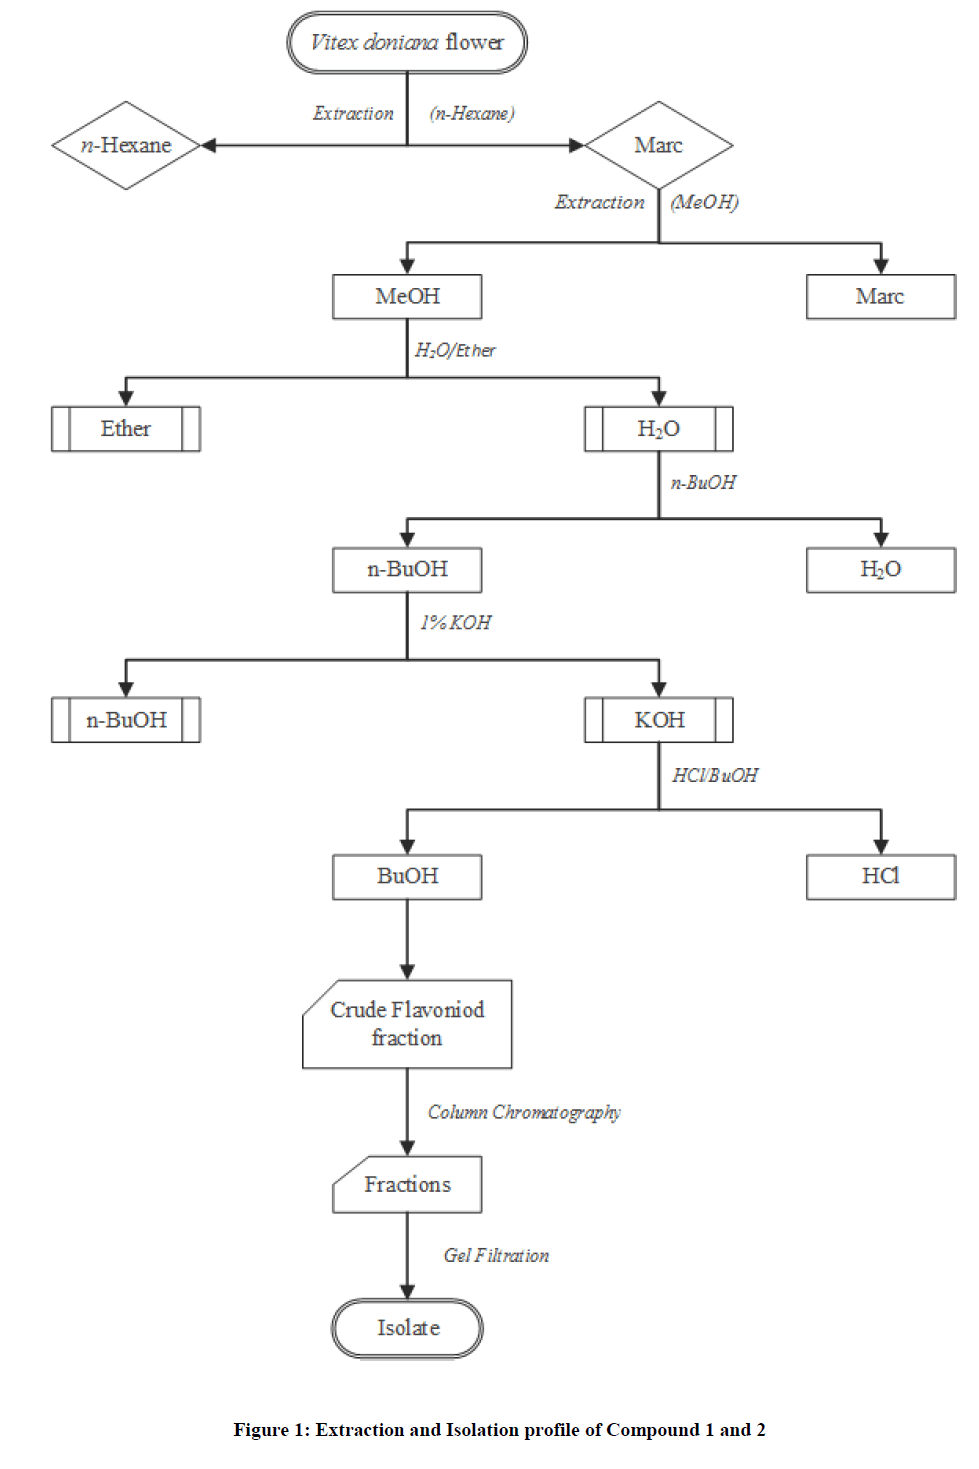
Figure 1: Extraction and Isolation profile of Compound 1 and 2
The process of elution was monitored using TLC analysis with precoated plate in different solvent system of ethylacetate:MeOH:water (100:13:10), Chloroform:MeOH:water (65:45:12) and n-BuOH:AcOH:H2O (4:1:5) upper layer. The chromatogram were spread with 10% H2SO4 and kept in oven at temperature of 105°C for 5 min after which it was removed to ascertain the compounds.
Acid hydrolysis
Compounds (1 and 2) 5 mg each in a mixture of 8% HCl (2 ml) and CH3OH (20 ml) were separately reflux for 2 h. The reaction mixtures were reduced in vacuo to dryness, dissolved in H2O (3 ml) and neutralized with NaOH. The neutralized products were subjected to TLC analysis eluent: (EtOAC:MeOH:H2O:HOAC. 6:2:1:1). Paper chromatography was carried out on what man No 1 paper using solvent systems: (i) n-BuOH-HOAC-H2O (4:1:5), (ii) HOAC-H2O (3:17) (iii) C6H6-n-BuOH-H2O-pyridine (1:5:3:3). The chromatograms were sprayed with aniline hydrogen phthalate followed by heating in the oven at 105°C for 5 min. The sugars were identified after comparison with authentic sugar samples (Table 1).
| Position  | |||
|---|---|---|---|
| C/H | DEPT | d C | d H |
| 2 | C | 157.08 | - |
| 3 | C | 133.61 | - |
| 4 | C | 176.62 | - |
| 5 | C | 161.43 | - |
| 6 | CH | 99.32 | 6.48(d,2.0) |
| 7 | C | 162.85 | - |
| 8 | CH | 94.72 | 6.72(d,2.0) |
| 9 | C | 156.04 | - |
| 10 | C | 105.60 | - |
| 1' | C | 120.92 | - |
| 2' | CH | 115.31 | 7.54 d (1.4) |
| 3' | C | 144.67 | - |
| 4' | C | 148.86 | - |
| 5' | CH | 116.04 | 6.83 (d, 7.6) |
| 6' | CH | 121.63 | 7.54 (dd, 1.4, 7.4) |
| 1'' | CH | 101.06 | 5.40 (1H, d, 6.7Hz) |
| 2'' | C | 74.30 | - |
| 3'' | C | 76.24 | - |
| 4'' | C | 69.40 | - |
| 5'' | C | 76.37 | - |
| 6'' | CH2 | 67.02 | - |
| 1''' | CH | 102.61 | 4.40 (S) |
| 2''' | C | Â 70.43 | - |
| 3''' | C | 71.02 | - |
| 4''' | C | 72.63 | - |
| 5''' | C | 68.20 | - |
| 6''' | CH | 17.83 | 0.98(d,6.4) |
| 1'''' | CH | 99.74 | 5.07 (d, 7.4) |
| 2'''' | C | 73.12 | - |
| 3'''' | C | 76.37 | - |
| 4'''' | C | 69.63 | - |
| 5'''' | C | 77.38 | - |
| 6'''' | CH2 | 61.45 | - |
Table 1: 1H NMR (400MHz) and 13C NMR (125 MHz), Spectral data for compound 1 in (CD3OD; d in ppm, J in Hz).
Compound 1 was isolated by repeated column chromatography on silica gel 60 F254 and subsequent repeated gel filtration on sephadex LH20 from the n-butanol portion of V. doniana. This was obtained as a yellow needle and the acid hydrolysis gave besides quercetin, glucose and rhamnose from Co TLC [17]. The UV spectrum showed absorption bands and reagent shift of compound 1 to be at 3, 7-disubstituted quercetin derivative [18,19]. The absence of free 7-hydroxyl group in compound 1 was observed due to lack of shift of Band II in the presence of NaOAC [20]. The 1H and 13C NMR spectra of compound 1 displayed a characteristic signals for quercetin moiety and three sugar residues [21,22]. The 1H NMR spectrum of compound 1 exhibited a triglycoside from the appearance of the three prominent anomeric proton signals at δH 5.40 (1H, d, J=6.7HZ), δH 5.07 (d, J=7.4HZ) and δH 4.40 (s) [23]. Considering the coupling constants in compound 1, this could be suggested that, the presence of two β-glucopyranose and a single α-rhamnopyranose are completely ascertained [24]. Compound 1 was found to exhibit twenty one methine groups on (C-6, C-8, C-2', C-5', C-6', C-1", C-2", C-3", C-4", C-5", C-1'",C-2'", C-3'", C-4'", C-5'",C-6'",C-1"", C-2"",C-3"", C-4"" and C-5""), two methylene groups on (C-6" and C-6""') and ten quaternary carbons on C-2, C-3, C-4, C-5, C-7, C-9, C-10, C-1', C-3' and C-4' [25,26].
The HMBC spectrum of compound 1 exhibited all intra molecular connections between carbons and hydrogen’s, hence exhibiting compound 1 to be a disubstituted quercetin derivatives (Figures 2 and 3). The HMBC also shows the long-range correlation between the anomeric protons as well as the carbon signal of the sugar moiety (α-Lrhamnose moiety which was found to be attached to the C-6 of the β-D glucose moiety (HMBC), hence justifying the disaccharide as 3-O-rutinoside [27,28]. The HMBC spectrum of compound 1 has also shown the equatorial proton on C-6 glucose which is place in an up field region and as such termed as β-D orientation [29,30]. The 1H-1H Cosy spectrum arrangement of the glucopyranose proton shows that, α-L-rhamnopyranose moiety been connected to β-D-glucopyranose, which was further substituted to C-3 position of the aglycone [31]. The positive and negative ions in CIMS Mass spectra of compound 1 showed a pseudo molecular ion (M+H)+ at m/z 757.4 and (M-H)- at m/z 755.5 which were in conformity with the molecular formula of C33H40O21.
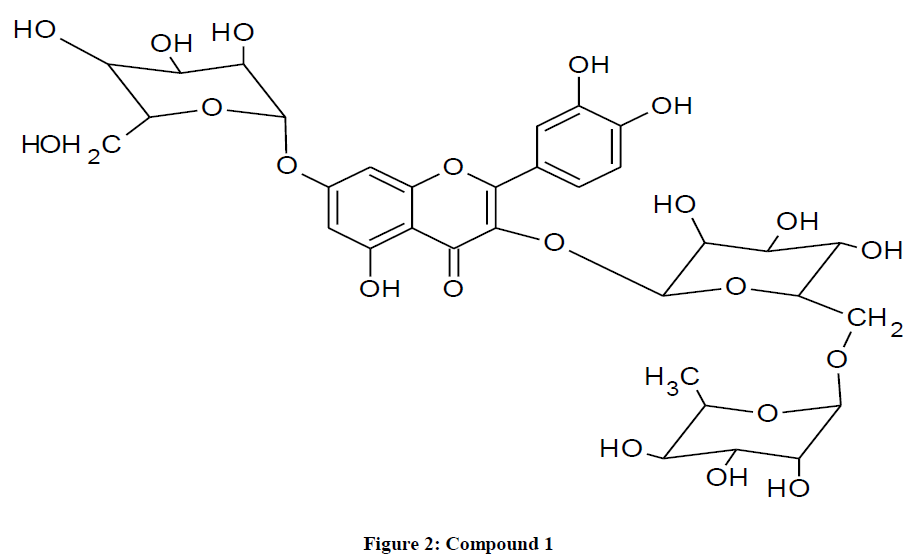
Figure 2: Compound 1.
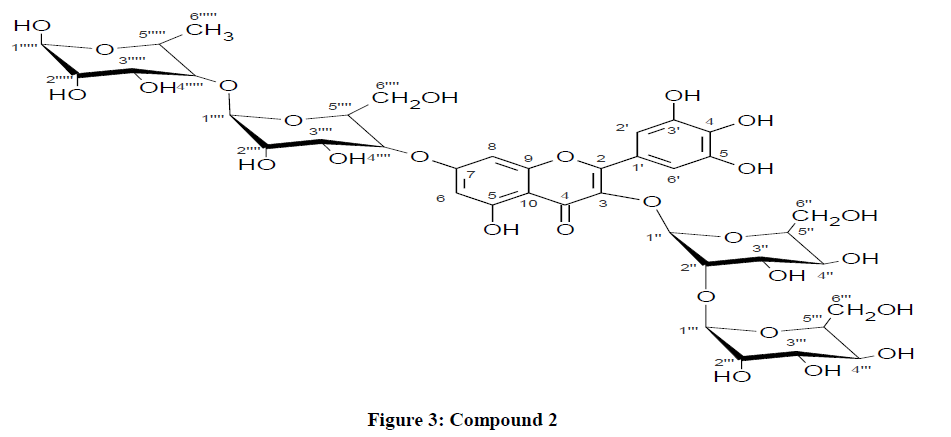
Figure 3: Compound 2.
In conclusion, on the basis of spectral analysis (FTIR, CIMS, ID and 2D NMR) and comparism with 1H NMR and 13C NMR for reference data, compound 1 was determine as 3-O-[α-L-rhamnopyranosyl-(1→6)-β-Dglucopyranosyl]- 7-O-(β-D glucopyranosyl)-quercetin.
Compound 2 was recognized as glucosyl flavonoid from a positive test with Hcl-mg powder and molish reagent [20,32]. The UV spectrum of compound 2 in MeOH showed an absorption maximum at 400 nm with a shoulder at 253 nm revealing the compound 2 [33]. This was also obtained as a yellow powder on an acid hydrolysis, which also yield glucose and rhamnose sugar residues as identified by TLC and PC co-chromatography with the authentic samples. The chemical ionization mass spectrum (CIMS) portrays a molecular [M+H]+ at m/z 951]. Fragments observed at m/z 789 which could be attributed to loss of sugar [M-162+H]+, while m/z 627 [M-2 × 162+H] + represents the loss of two sugar molecules. The peak at 481 [M-146 – 2 × 162 +H]+, could be attributed to the loss of two glucose and a rhamnose respectively [34].
The 1H NMR spectrum of compound 2 displayed four anomeric proton signals at δH 5.60 (d) J=7.6HZ, δH 5.40 (d, J=1.6HZ), δH 4.54 (d, J=7.6HZ) and δH 5.40(d,j=1.6Hz). The prominent peaks at δH 6.31(d, J=2.0), δH 3.75(m), 3.50(m) and δH 3.84(m), 3.61(m) could be attributed to the glycosylation of (3-O-glucose), (2"-O-glucose) and (7-O-rhamnose) moiety as exhibited by HMBC [35]. The 1H NMR spectrum shows the two glucose residue been attached as terminal sugars i.e glucosyl glycoside and glucosyl rhamnoside bioses [36]. The UV absorption data recorded in MeOH with the addition of shift reagents suggested that, free OH groups are present at positions C-5,C-3', C-4' and C-5' [37]. The 1H NMR spectrum exhibited two meta coupled doublet at δH 6.50 ppm (H-8) and δH 6.31 (H-6) and two protons singlet at δH 7.60 ppm assigned to H-2' and H-6' [38].
The UV data recorded in MeOH with addition of shift reagents suggested that the free OH groups are attached to positions C-5, C-3', C-4' and C-5' which is been supported by NMR spectrum peaks at δc 12.70 (OH-5), 9.20-8.30 (OH-3', 4' and C-5') and this tends to disappears upon the addition of D2O. The evidence for the localization of the sugar moieties on the aglycone was also supported by 13C NMR (Table 2) of compounds 2 which is in conformity with myricetin [39]. The shielding effect of both C-3 (δc-134.8) and C-7/δc 162.6 were in complete agreement while the deshielding effect of C-4 (δc179.2), C-2(δc156.7), C-8(δc94.3) and C-6(δc99.3) indicated the glycosidation sites of C-3 and C-7 [40]. However, this was also supported by HMBC correlation between the rhamnose anomeric proton at δc 162.6 ppm (C-7) and the glucose anomeric proton δHa 162.5 ppm for C-5. The 'H-'C, Cosy spectrum portrays an unambiguous data which was used to determine the inter glycosidic linkages between the sugars. The signals at δHa 3.75 ppm/C-6" signifies the glycosylation position of the 2"-O-glucose residue while signals observed at δHa 3.84 ppm/C-6"' justifies the glycosylation position of 7-O-rhamnose residue [41].
| Position | dH | dC |
|---|---|---|
| 2 | - | 156.7 |
| 3 | - | 134.8 |
| 4 | - | 179.2 |
| 5 | - | 162.5 |
| 6 | 6.31(d)J=2.0 | 99.3 |
| 7 | - | 162.6 |
| 8 | 6.50(d) J=2 | 94.3 |
| 9 | - | 156.0 |
| 10 | - | 105.4 |
| 1' | - | 121.2 |
| 2' | 7.60(3) | 109.5 |
| 3' | - | 147.3 |
| 4' | - | 137.9 |
| 5' | - | 147.3 |
| 6' | 7.60 (3) | 109.6 |
| 1'' | 5.60 (d) J=7.6HZ | 98.6 |
| 2'' | 4.10 (m) | 81.2 |
| 3'' | 3.70(m) | 77.4 |
| 4'' | 3.40 (m) | 73.2 |
| 5'' | 3.20 (m) | 76.2 |
| 6'' | 3.75 (m), 3.50 (m) | 61.3 |
| 1''' | 4.60 (d) 7.5HZ | 103.5 |
| 2''' | 3.35 (m) | 74.5 |
| 3''' | 3.43 (m) | 76.4 |
| 4''' | 3.24 (m) | 72.4 |
| 5''' | 3.19 (m) | 76.3 |
| 6''' | 3.84 (m), 3.61 (m) | 62.3 |
| 1'''' | 4.5 (d) j=7.6 | 103.7 |
| 2'''' | 3.30 (m) | 74.4 |
| 3'''' | 3.45 (m) | 76.6 |
| 4'''' | 3.14 (m) | 70.4 |
| 5'''' | 3.60 (m) | 77.5 |
| 6'''' | 3.92(m),3.77(m) | 62.7 |
| 1''''' | 5.40 (d) J=1.6HZ | 101.7 |
| 2''''' | 4.20 (m) | 70.2 |
| 3''''' | 4.10 (m) | 71.5 |
| 4''''' | 3.80 (m) | 83.5 |
| 5''''' | 3.68 (m) | 68.3 |
| 6''''' | 1.05 (d), j=6.4 | 17.6 |
Table 2:Â 1H NMR (400MHz) and 13C NMR (125 MHz), Spectral data for compound 2 in (CD3OD; d in ppm, J in Hz).
In 13CNMR spectrum, the inner glucose was shown to be linked to another terminal sugar through the (1 →2) bond linkage on the bases of glucosyl C-2" down field shift of (+4 ppm) at δc 81.2 ppm, indicating that the bios is at β-glucosyl (1→2)-glucoside. So also the inner rhamnose was also found to be linked to another terminal glucose through (1→4) bond on the basis of rhamnosyl C-4"' down field shift of (+3 ppm) at δc 72. 4 ppm, hence suggesting the bios position to be β-glucosyl (1→4)-α-rhamnoside [41,42].
The 1H-13C-Cosy studies also confirmed the correlation between the identified protons with their carbon signals. The glycosylated carbon signal at δc 81.2 ppm was correlated with C-2" linked to proton at δHa 4.10 ppm, in which the rhamnosylated carbon at δc72.4 ppm was also correlated with the C-4"' linked proton at δHa 3.24 ppm. The HMBC spectrum also confirmed the aforementioned evidence and correlation peaks between the anomeric protons at δHa 4.60 ppm (H-1"') and δc 81.2 ppm (C-2") and δHa 5.4 ppm (H-1 ""') with the signal at δc 72.4 (C-4"") were found to be observed.
Consequent upon this, the available spectral data where in conformity with data reported for β-D-glucosyl (1→2)-β-glucoside and β-D-glucosyl (1→4)-α-rhamnoside. Base on the aforementioned evidence, compound 2 is determined to be myricetin 3-O-β-D-glucosyl (1→2)-β-glucoside-7-0-β-D glucosyl-(1→4)-α-rhamnoside.