Research Article - Annals of Biological Research ( 2018) Volume 9, Issue 3
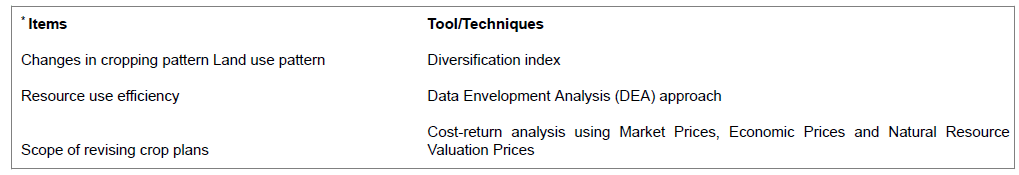
This paper evaluates the crop diversification natures in terms of the variations in cropping pattern with respect to land and productive resource distribution. Both the aspects of acreage and production, it is detected that with the time span of last three decades the cropping pattern in West Bengal is progressively lead by paddy both aus and boro, rapeseed and mustard jute, potato. Pulses crop as a total, have lost both in terms of area and productivity in West Bengal. The Technical efficiency (TE), allocative efficiency (AE) and economic efficiency (EE) are evaluated with the help of DEA software under the conjecture of Variable returns to scale and (Table 9.1). The EE scores for crops grown under rainfed condition range from 0.03 in the case of cowpea to 0.85 for Sugarcane. The TE scores for rainfed condition ranged from 0.46 in the case of cowpea to 0.98 in the case of Sugarcane. The EE scores for crops grown under irrigated condition range from 0.10 in the case of red gram and green gram to 0.57 for Paddy. The TE scores for irrigated condition ranged from 0.41 in the case of greengram to 0.97 in the case of paddy.
DEA software, Allocative efficiency, Technical efficiency, Crop diversification.
Agriculture shows a leading part in commercial and economic growth through providing food and nutrition for the country. It also creating prospects of occupation, and sharing of nationwide GDP as well as suppling raw inputs for agriculture based industries [1]. In India, around 57 % of people are engage on crop cultivation and animal husbandry [2-5]. During 1985-86 and 1992-93, the agricultural contribution to the SDP was increasing at about 4.7 per cent per annum, while the overall growth was 5.1 per cent per annum. A number of facilities for irrigation have been opened up and the consumption of chemical fertilisers has gone up from 558 thousand tonnes to 1109 thousand tonnes in between 1985-90 and 1997-02. This point is to an increase in the application of fertilisers to the extent of over 36 per cent. Aided by these improvements in the use of hyv rice almost is doubled between 1985-86 and 1992-93(Sarkar, 2018).
Both the aspects of acreage and production, it is detected that with the time span of last three decades the cropping pattern in West Bengal is progressively lead by paddy both aus and boro, rapeseed and mustard jute, potato. Pulses crop as a total, have lost both in terms of area and productivity in West Bengal. Agriculture dwell in an significant place in the frugality of West Bengal. It not only delivers food to the bulky and fast rising people but also raw supplies to numerous agro-based businesses. In the past three decades agricultural activity has moved from survival to commercial agriculture.
Nature and sources of data
Both the secondary data and primary [CCS data] were used in the study. Secondary data sources for few indicators like for subsidy rate on fertilizers and electricity the data were procured from the Department of Agriculture, DES, GoI and West Bengal State. Statistical Abstract of West Bengal (Various issues) have been used to collect data on various cropping and irrigation parameters of state’s agriculture.
Estimation of cost and returns
The costs were classified into variable and fixed costs. Variable cost includes cost of inputs, labour cost, interest on working capital and miscellaneous costs. Fixed costs were defined to include depreciation on farm implements, land revenue and taxes. While the returns included value of both main product and by-product.
Technical, allocative and cost efficiencies
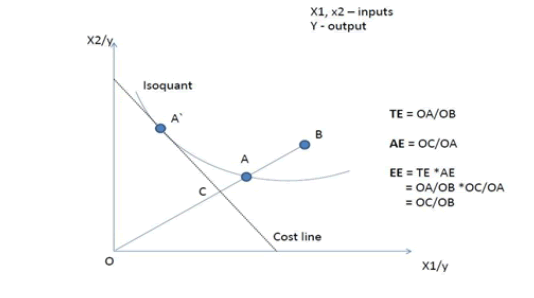
The term Technical efficiency or output oriented efficiency (TE) refers to the capacity of a farmhouse to yield the maximum feasible product from a given mix of resources, or the minimum feasible extents of resources to produce a given level of output. Allocative efficiency or pricing efficiency (AE) denotes to the capacity of a technically efficient farm to use resources in proportions that minimize costs of production given resources prices. Allocative efficiency is calculated based on the ratio of the minimum costs of production required by the farmhouse to yield a given level of outputs and the actual costs of the farm adjusted for TE. Economic Efficiency (EE) is the product of TE and AE. Thus, a farm is economically efficient if it is both technically and allocatively efficient. The general method of appraising the maximum conceivable output has been the Data Envelopment Analysis (DEA) supported by Charnes et.al. (1978).
Data envelopment analysis
The DEA technique is a frontier analysis method that does not necessitate functional form or a distributional form specification, and it can lodge scale problems. DEA used to apply by using both classic function or models constant returns to scale with resource positioning, in which one seeks input optimiztion to obtain a particular product level. Under conjecture of constant returns to scale, the linear programming (LP) models for calculating the both efficiency of farms are (Coelli et. al., 1998).
Estimation of technical efficiency
Minimization
Subject to
θXi – Xλ ≥ 0
λ ≥ 0 (4)
Where,
yi is a vector (m×1) of output of the ithProducing Farms (TPF)
xi is a vector (k×1) of inputs of the ithTPF
Y is an output matrix (n×m) for n TPFs
X is an input matrix (n× k) for n TPFs
θ is the efficiency score, a scalar whose value will be the efficiency measure for the ith TPF. If θ=1, TPF (Total productivity factor) will be efficient; otherwise, it will be inefficient.
The λ is a parameter (nx1) whose standards are considered to achieve the optimum solution. The λ values will be the weights used or an inefficient TPF, in the linear combination of other. The effective, TPFs which effect the forecast of the ineffective TPF on the calculated frontier.
Estimation of allocative efficiency and cost efficiency (economic efficiency)
If any researcher having price information and is ready to consider a developmental objective, such as cost optimization or income maximization, then he can quantify both technical and allocative efficiencies by DEA. One would run the following cost minimization DEA for estimation of cost efficiency (or economic efficiency) as follows
Min λ, Xi* Wi Xi*,
Subject to –yi + Yλ ≥0,
Xi*- Xλ ≥0,
N1 λ ≥ 1
λ ≥0, (5)
Where,
Wi is a vector of input prices for the ith Total Productivity Factor (TPF),
Xi is the cost minimizing vector of input quantities for the ith TPF (which is calculated by the LP) ,
Given the resource prices Wi and the production levels Yi. The total cost efficiency (CE) or economic efficiency of the ith TPF can be considered as
CE = WiXi*/ WiXi (6)
i.e., the fraction of lowest cost to detected cost. One can then practice equation no. 6 to calculate the allocative efficiency residually as
AE= CE/TE (7)
| Forest area | Area under non-agricultural use | Barren & uncultur-able land | Permanent pasture & other grazing land | Land under misc. trees & grooves not included in net area sown | Culturable waste land | Fallow land other than current fallow | Current fallow | Net area sown | Reported area (in million hectares) | |
|---|---|---|---|---|---|---|---|---|---|---|
| India | 22.66 | 7.7 | 6.29 | 3.56 | 1.1 | 4.46 | 3.33 | 4.83 | 46.07 | 306.26 |
| West Bengal | 13.48 | 18.52 | 0.31 | 0.06 | 0.67 | 0.4 | 0.25 | 3.84 | 62.89 | 9.69 |
Table 1: Land use pattern in West Bengal state during the period 1980-81 to 2011-12.
Diversification index for the West Bengal
In the present study, among the various indices of studying the extent of crop diversification at a given point of time like Herfindahl Index (HI); Transformed Herfindahl Index (THI); Ogive Index (OI); Entropy Index (EI); Modified Entropy Index (MEI); Composite Entropy Index (CEI); Gini’s Coefficient (Gi); and Simpson Index (SI) of Diversification has been employed to measure degree of crop diversification and is explained as follows:
SI =1 – Σ (pi / Σ pi) 2
Where, pi is the area proportion of the ith crop in total cropped area and i = 1,2,3,….n. is the number of crops. This index was first used to measure the regional concentration of industries (Theil, 1967). The value of HI is bounded by 0 (perfect diversification4 ) and 1 (complete specialization).
Cropping pattern on sample farms
It could be observed from the Table 2 that rice was the major crop on the sample farms accounting for about 23 per cent followed by potato, sugarcane and mustard which together accounted for 2/3rd of the GCA and jute was the leading crop among oilseeds under rainfed situation.
| SN | Particulars | n (No. of observations) | TE 2014-15 (ha) | % of Sample GCA |
|---|---|---|---|---|
| 1 | Bajra | 18 | 62.6 | 1.53 |
| 2 | Mustard | 183 | 742.9 | 18.17 |
| 3 | Maize | 18 | 62.6 | 1.53 |
| 4 | Paddy | 228 | 939.21 | 22.97 |
| 5 | Potato | 183 | 742.9 | 18.17 |
| 6 | Wheat | 48 | 193.89 | 4.74 |
| 7 | Cowpea | 10 | 36.09 | 0.88 |
| 8 | Gram | 18 | 55.38 | 1.35 |
| 9 | Green gram | 52 | 183.87 | 4.5 |
| 11 | Sugarcane | 61 | 200.03 | 4.89 |
| 12 | Jute | 95 | 373.44 | 9.13 |
| 13 | Safflower | 12 | 49.42 | 1.21 |
| 14 | Cotton | 7 | 23.25 | 0.57 |
| Gross cropped area | 1045 | 4089.27 | 100 |
Table 2: Cropping pattern from sample data under Rainfed situation TE-2014-15. Source: Govt. of WB, Dept. of Applied Economics and Statistics.
As expected under canal irrigated situation paddy being the more water intensive crop accounted for about 60 per cent of the GCA, rice and potato are the other two distantly competing crops for area with a share of about ten and seven per cent of the GCA on the sample farms.
Table 3 shows a distinction between the growth rates of different main crops and crops group during the period of 1990-91 to 2014-15. From the above table it can be detected that there has been a significant develop in output over a period in case of single crops like rice, rapeseed and mustard, sugarcane,jute and potato.
| Crops | Growth Rate of Output |
|---|---|
| Rice | 92.16 |
| I. Aus | 1.84 |
| II. Aman | 51.17 |
| III. Boro | 399.38 |
| Potato | 402.12 |
| Sugarcane | 1643.46 |
| Jute | 84.93 |
| Total food Grains | 91.52 |
| Rapeseed & Mustard | 326.65 |
| Total pulses | -23.46 |
Table 3: Growth Rate of production of different Crop in West Bengal during 1990-91 to 2014-15. Source: Govt. of WB, Dept. of Applied Economics and Statistics.
Diversification index for the West Bengal
Thus it could be inferred from the Table 4 that the West Bengal state had a highly diversified cropping pattern as the value of SDI approached unity during the study period.
| Particulars | TE 1994-95 | TE 2004-05 | TE 2014-15 |
|---|---|---|---|
| Simpson Diversity Index (SDI) during triennium ending | 0.7698 | 0.7883 | 0.8002 |
Table 4: Crop Diversification Index for West Bengal state.
Crop wise farm technical, efficiency, allocative and economic efficiency
In simple terms, Technical Efficiency (TE) reflects the ability of the firm to obtain a given output with minimal input. The Allocative Efficiency (AE) reflects the ability of a firm to use the inputs in optimal proportions. The Economic Efficiency (EE) is the product of the two efficiencies. The following diagram explains the concepts.
The TE, AE and EE are calculated using the DEA software under the assumption of Variable returns to scale and (Table 4). The EE scores for crops grown under rainfed condition range from 0.03 in the case of cowpea to 0.85 for Sugarcane; The TE scores for rainfed condition ranged from 0.46 in the case of cowpea to 0.98 in the case of Sugarcane; The EE scores for crops grown under irrigated condition range from 0.10 in the case of red gram and green gram to 0.57 for Paddy; The TE scores for irrigated condition ranged from 0.41 in the case of greengram to 0.97 in the case of paddy; Table 5).
| SN | Crops | Rainfed | ||
|---|---|---|---|---|
| TE | AE | EE | ||
| Paddy | 0.97 | 0.72 | 0.7 | |
| Maize | 0.74 | 0.42 | 0.31 | |
| Wheat | 0.9 | 0.9 | 0.81 | |
| Cowpea | 0.46 | 0.06 | 0.03 | |
| Gram | 0.61 | 0.17 | 0.1 | |
| Greengram | 0.98 | 0.68 | 0.67 | |
| Redgram | 0.51 | 0.31 | 0.16 | |
| Soyabean | 0.82 | 0.58 | 0.48 | |
| Groundnut | 0.55 | 0.37 | 0.2 | |
| Sugarcane | 0.98 | 0.87 | 0.85 | |
| Mustard | 0.85 | 0.68 | 0.58 | |
| 13 | Potato | 0.71 | 0.7 | 0.5 |
Table 5: Technical, allocative and economic efficiency of crops by considering variable returns to scale in West Bengal TE 2014-15.
| SN | Crops | Irrigated | ||
|---|---|---|---|---|
| TE | AE | EE | ||
| Paddy | 0.97 | 0.59 | 0.57 | |
| Maize | 0.6 | 0.6 | 0.36 | |
| Wheat | 0.82 | 0.58 | 0.48 | |
| Cowpea | 0.6 | 0.39 | 0.23 | |
| Gram | 0.5 | 0.41 | 0.21 | |
| Redgram | 0.63 | 0.16 | 0.1 | |
| Potato | 0.79 | 0.77 | 0.61 | |
| Sugarcane | 0.91 | 0.5 | 0.46 | |
| Groundnut | 0.5 | 0.4 | 0.2 | |
| Mustard & Rapeseed | 0.64 | 0.58 | 0.37 | |
| Soyabean | 0.53 | 0.38 | 0.2 | |
| 13 | Greengram | 0.41 | 0.25 | 0.1 |
Table 6: Technical, allocative and economic efficiency of crops by considering variable returns to scale in West Bengal TE 2014-15.
The present chapter has analysed the nature of crop diversification in terms of the changes in cropping pattern with respect to acreage and production distribution. In the case of crops grown under borewell irrigation condition during the period TE 2014-15, the highest fertilizer subsidy and irrigation subsidy was received by the Sugarcane growers followed by Paddy growers, as both were the water and fertilizer intensive crops. Generally for pulse crops, fertilizer and irrigation subsidies were low and the highest fertilizer subsidies recorded in Gram. Besides being remunerative, oilseed crop also require less irrigation which makes them ideal for cultivation in the areas with less rain or irrigation. Pulses, as a whole, have lost both in terms of acreage and production in West Bengal. The indices of diversification mostly indicate an increasing degree of crop diversification over time. The annual growth rates in term of acerage and production of mail food grain crops like paddy,mustard,jute and potatoes show decreasing movements during the second period. As a conclusion, we can say that the cropping pattern alteration in West Bengal has undeniably been an emerging veracity which is replicated through adoption of a diversification cropping pattern by the farmers.