Research Article - Archives of Applied Science Research ( 2017) Volume 9, Issue 3
Background and objective: Eleyele Lake is a multipurpose lake in the metropolitan city of Ibadan that receives
wastes from the surrounding communities. The objective of the study was to check the quality of the lake water with
respect to different physico-chemical parameters and also determine the Water Quality Index of the lake.
Materials and methods: Water samples were collected for three months at three different sites and analyzed for
physico-chemical parameters using standard methods. These sites were selected to assess the quality of the waterbefore
the lake, on the lake and after the lake. Samples were taken with proper measures such as preservation,
storage and labeling, were taken. Collected data were analyzed using Microsoft Excel 2013. Statistical analysis was
performed with SPSS software using one-way ANOVA.
Results: The study showed that most of the physico-chemical parameters were significantly different (P<0.05)
between the sites. Water Quality Index showed that the water quality at the sites was poor.
Conclusion: The results indicate that the lake is polluted and not totally safe for human consumption without
proper treatment.
Water quality index, Eleyele Lake, Pollution, Anthropogenic activities, Physico-chemical
Water resources are equally important for natural ecosystem and human development; it is essential for agriculture, industry and human existence. Hence, water is an indispensable component for survival of life on earth, which contains minerals, important for humans as well as for earth and aquatic life [1]. Any alterations in water quality may lead to the issue of survival for these organisms. The growing human and environmental influences impact strongly on the quantity and quality of water available in any lake system. The determination of the chemical, physical and biological characteristics of natural water resources to check and maintain the water quality for a healthy survival become an urgent demand everywhere in the world because of the increased demand of water for sustenance of life as a consequence of population growth, agriculture and industrial development building construction [2]. Eleyele Lake is of tremendous ecological and economic importance; it provides water for domestic, agricultural and industrial use, support subsistence and artisanal fisheries. It is completely surrounded by various communities that discharge their domestic waste directly into the lake water. When wastes from different sources are discharged into the water body that alter the physical, chemical and biological characteristics of the water body in such a way that it may not be useful for the purpose for which it is intended [3]. Environmental pollutants arising from anthropogenic source have the potential to affect the aquatic ecosystem in a synergistic manner. The productivity and growth of aquatic organisms depend on the physicochemical characteristics of the water body [4,5] and maximum productivity can only be obtained at optimal level of physico-chemical parameters [6]. It is therefore very essential and important to test the water before it is used for drinking, domestic, agricultural or industrial purpose. Quality assessment involves the analysis of physico-chemical, biological and microbiological parameters that reflect the biotic and abiotic status of the ecosystem [7]. Water quality monitoring has a high priority for the determination of current conditions and long-term trends for effective management. Water quality indices are intended to provide a simple but reliable tool for managers and decision makers on the quality of water for a wide range of uses for a given set of water bodies [7].
The ever increasing importance and threats to the long-term sustainability of the lake due to anthropogenic activities makes this study extremely relevant. The objective of the study was to check the quality of the lake water with respect to different physico-chemical parameters and compare results of different physico-chemical parameter values with standard values and also determine the Water Quality Index of the lake which has not been reported in literature.
Study area
Lake Eleyele is situated in North-west of Ibadan, Oyo State, Nigeria at an altitude of 125 m above sea-level and between7°25’00’ and 7°26’30’N latitudes and 3°51’00’ and 3°52’30’E longitudes (Figure 1). The lake is manmade and was formed in 1939 by damming of the Ona River (part of a dense network of inland waterways that flow southward into the Lagos Lagoon), and the Otaru, Awba, Yemoja and Alapo streams also empty into the lake. Imevbore [8] described the hydrology of the lake. The Lake is usually flooded with the water level rising during early period of rainy season. It covers some parts of Ijokodo, Apete, Awotan, Ologun-eru, Agbaje, Idi-Osan, Polytechnic of Ibadan and Eleyele area with the rural fishing communities mostly dominated by Ilaje and Yorubas. Human activities in the area include fishing, car washing, block making, clothes washing, automobile repairing, farming, agro processing and boat trafficking.
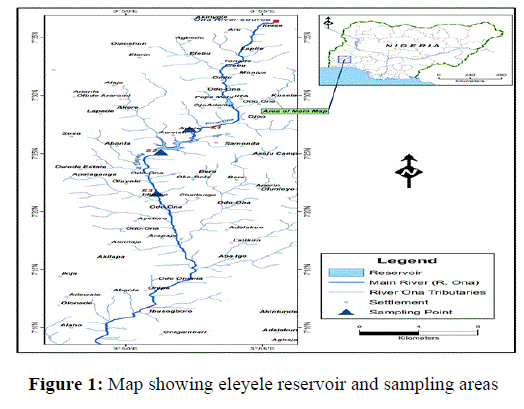
Figure 1: Map showing eleyele reservoir and sampling areas
| Parameters | Site A | Site B | Site C |
|---|---|---|---|
| Colour (Hazel units) | 6.33 ± 0.29a | 3.50 ± 0.00b | 4. 00 ± 0.00b |
| Turbidity (mg/l) | 5.50 ± 0.44a | 2.1 ± 0.01b | 2.13 ± 0.15b |
| pH | 7.00 ± 0.00 | 7.00 ± 0.00 | 7.20 ± 0.00 |
| Conductivity (µS/cm) | 319.67 ± 1.53a | 601.67 ± 1.53b | 306.67 ± 1.52c |
| Total solid (mg/l) | 2148.33 ± 12.5a | 2026.67 ± 35.11b | 1918.33 ± 12.58c |
| TDS (mg/l) | 321.67 ± 2.89a | 258.33 ± 7.63b | 421.67 ± 2.89c |
| TSS (mg/l) | 1826.67 ± 15.28a | 1768.33 ± 42.52b | 1496.67 ± 10.40c |
| DO2 (mg/l) | 2.20 ± 0.10a | 2.53 ± 0.06a | 2.77 ± 0.15b |
| BOD (mg/l) | 9.37 ± 0.15a | 6.97 ± 0.15b | 6.20 ± 0.26c |
| COD (mg/l) | 21.47 ± 0.15a | 15.43 ± 0.21b | 14.33 ± 0.15c |
| Alkalinity (mg/l) | 1.23 ± 0.06a | 1.00 ± 0.10b | 0.73 ± 0.15c |
| Total hardness (mg/l) | 65.23 ± 0.25a | 70.50 ± 0.20b | 69.23 ± 0.15c |
| Phosphate (mg/l) | 2.13 ± 0.12a | 1.47 ± 0.15b | 1.13 ± 0.15c |
| Chloride (mg/l) | 16.47 ± 0.25a | 12.17 ± 0.15b | 9.63 ± 0.15c |
| Calcium (mg/l) | 73.33 ± 2.89a | 83.33 ± 2.89b | 75.00 ± 0.00a |
| Magnesium (mg/l) | 26.67 ± 2.89a | 22.33 ± 2.52 | 17.67 ± 2.52a |
| NO3- (mg/l) | 1.30 ± 0.10a | 1.03 ± 0.06b | 0.87 ± 0.01c |
| Total organic carbon | 0.87 ± 0.06%a | 0.60 ± 0.00%b | 0.50 ± 0.00%c |
| Total organic matter | 1.10 ± 0.10%a | 0.70 ± 0.10%b | 0.57 ± 0.06%b |
Mean values in similar row with different letters are significantly different (p<0.05).
Table 1: The average values of physico-chemical parameters collected from the sites
Sample collection and analysis
Three sampling points (1-3) depicting regions of high activities and low activities were identified for surface water sampling. Sampling Site S1 (7°27’05”N: 3°52’19”E) is along Ona River at Apete community very close to the shore of the lake. Sampling Point S2 (7°25’06”N: 3°51’16”E) is on the lake water while sampling point S3 (7°21’32”N: 3°51’07”E) is about 5 km away along the river after the lake where there is less anthropogenic activities. These sites were selected to assess the quality of the water before the lake, on the lake and after the lake. Site 1 represents the main entrance of water; agricultural and domestic wastes from Apete community, Ibadan Polytechnic and University of Ibadan to the lake. Sites 2 is on the lake, where mostly boating occurs for fishing, and which also receives wastes from block making industries, ‘garri’ pcocessing factories and car-wash spots, automobile repairing workshops and domestic wastes from Ijokodo, Awotan, Ologun-Eru, Agbaje, Idi-Osan and Eleyele area.
The water samples were collected in the polyethylene bottles that were initially rinsed with sample water. Samples were collected during morning hours in between 8.00 to 10.00 a.m. using 1 L container for the period of three months during the rainy season (September to November, 2016) to investigate the various physico-chemical characteristics of Eleyele Lake. Three bottles (1, 2 and 3) were used to collect water sample from each site and were used respectively for the determination of microbiological, physico-chemical and BOD, COD parameters. The co-ordinates of the sampling points were taken using a Geographic Position System (GPS). Samples were taken with proper measures such as preservation, storage and labeling. Winkler’s bottles were used to collect samples for BOD measurements.
All water samples were stored in insulated cooler containing ice packs and delivered on the same day to laboratory and all samples were kept at 4°C until processing and analysis [9]. The various physico-chemical parameters were analyzed as per standard method [9] and data were recorded during the study period.
All statistical analysis was performed using SPSS software version 17. Water parameters were initially subjected to a t-test. Comparisons were made using one-way ANOVA. Where there are significant differences at P<0.05.
The standards for the drinking water, recommended by the Indian Council of Medical Research [10], World Health Organization [11] and Bureau of Indian standards [12] were considered for the computation of quality rating (Qn) and unit weights (Wn). Thirteen water quality parameters were selected for the purpose of calculation of WQI for the sampling sites.
Water Quality index was calculated for each of the sampling sites using weighted arithmetic index method [13] according to the following equations:
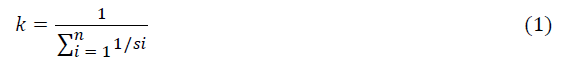
where k=constant of proportionality
Si=permissible limit for the ith parameter
n=number of parameters

Quality Rating Scale (Qi)=100[(Vi-Vo/Si-Vo)]
Where, Vi is estimated concentration of ith parameter in the analysed water
Vo is the ideal value of this parameter in pure water
Vo=0 (except pH=7.0 and DO=14.6 mg/l)
Si is recommended standard value of ith parameter.
Water Quality Index (WQI) is then calculated from the following equation
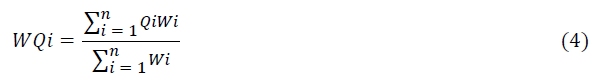
Table 1 shows the mean values of the parameters for each of the sampling sites. The highest values of colour, turbidity, total solid, total suspended solid, BOD, COD, alkalinity, phosphate, chloride, magnesium, nitrate, total organic carbon, total organic matter were recorded in sampling site A. The highest values of conductivity, calcium and total hardness were recorded in sampling site B while the highest values of pH, Total dissolved solid, DO2 were recorded in sampling site C. There was a significant difference at P<0.05 in the values of conductivity, Total dissolved solid, Total solid, Total suspended solid, BOD, COD, Alkalinity, Total hardness, Phosphate, chloride, Nitrates, Total organic matter and Total organic carbon of the water among the sampling sites. But there was no significant difference in the values of colour and Turbidity between sampling sites B and C while in the values of DO2; there was no significant difference between sampling sites A and B. There was a significant difference in values of calcium among the sites except between sites A and C while there was no significant difference in the values of calcium among the sites except sites A and C.
| S/N | Parameters | Observed values | Standard values (Sn) | Unit weight (Wn) | Quality rating (Qn) | QnWn |
|---|---|---|---|---|---|---|
| 1 | Colour (Hazel units) | 6.33 | 5 | 0.1092 | 126.6 | 13.82 |
| 2 | Turbidity (mg/l) | 5.5 | 5 | 0.1092 | 110 | 12.01 |
| 3 | pH | 7 | 6.5-8.5 | 0.084 | 0 | 0 |
| 4 | Conductivity (µS/cm) | 319.67 | 300 | 0.002 | 106.6 | 0.21 |
| 5 | TDS (mg/l) | 321.67 | 500 | 0.001 | 64.32 | 0.06 |
| 6 | DO2 (mg/l) | 2.2 | 5 | 0.546 | 129.21 | 70.55 |
| 7 | BOD (mg/l) | 9.37 | 5 | 0.546 | 187.41 | 102.33 |
| 8 | Total hardness (mg/l) | 65.23 | 300 | 0.002 | 21.7 | 0.04 |
| 9 | NO3- (mg/l) | 1.3 | 45 | 0.012 | 2.91 | 0.03 |
| 10 | Chloride (mg/l) | 16.47 | 250 | 0.002 | 6.59 | 0.01 |
| 11 | Alkalinity (mg/l) | 1.23 | 120 | 0.005 | 1.03 | 0.01 |
| 12 | Calcium (mg/l) | 73.33 | 75 | 0.007 | 97.8 | 0.68 |
| 13 | Magnesium | 26.67 | 30 | 0.018 | 88.9 | 1.6 |
| In Total | 1.43 | 943.07 | 201.35 |
Table 2: Calculation of water quality index for sampling site A
| S/N | Parameters | Observed values | Standard values (Sn) | Unit weight (Wn) | Quality rating (Qn) | QnWn |
|---|---|---|---|---|---|---|
| 1 | Colour (Hazel unit) | 3.5 | 5 | 0.1092 | 70 | 7.64 |
| 2 | Turbidity (mg/l) | 2.1 | 5 | 0.1092 | 42 | 4.59 |
| 3 | pH | 7 | 6.5-8.5 | 0.084 | 0 | 0 |
| 4 | Conductivity (µS/cm) | 601.67 | 300 | 0.002 | 200.56 | 0.4 |
| 5 | TDS (mg/l) | 258.33 | 500 | 0.001 | 51.67 | 0.05 |
| 6 | DO2 (mg/l) | 2.53 | 5 | 0.546 | 125.73 | 68.65 |
| 7 | BOD (mg/l) | 6.97 | 5 | 0.546 | 139.4 | 76.11 |
| 8 | Total hardness (mg/l) | 70.5 | 300 | 0.002 | 23.5 | 0.05 |
| 9 | NO3- (mg/l) | 1.03 | 45 | 0.012 | 2.28 | 0.03 |
| 10 | Chloride (mg/l) | 12.17 | 250 | 0.002 | 4.87 | 0.01 |
| 11 | Alkalinity (mg/l) | 1 | 120 | 0.005 | 0.83 | 0.01 |
| 12 | Calcium (mg/l) | 83.33 | 75 | 0.007 | 111.1 | 0.78 |
| 13 | Magnesium | 22.33 | 30 | 0.018 | 74.43 | 1.34 |
| In Total | 1.43 | 846.37 | 159.66 |
Table 3: Calculation of water quality index for sampling site B
| S/N | Parameters | Observed values | Standard values (Sn) | Unit weight (Wn) | Quality rating (Qn) | QnWn |
|---|---|---|---|---|---|---|
| 1 | Colour (Hazel unit) | 4 | 5 | 0.1092 | 80 | 8.74 |
| 2 | Turbidity (mg/l) | 2.13 | 5 | 0.1092 | 42.6 | 4.65 |
| 3 | pH | 7.2 | 6.5-8.5 | 0.084 | 13 | 1.092 |
| 4 | Conductivity (µS/cm) | 306.67 | 300 | 0.002 | 102.22 | 0.2 |
| 5 | TDS (mg/l) | 421.67 | 500 | 0.001 | 84.33 | 0.08 |
| 6 | DO2 (mg/l) | 2.77 | 5 | 0.546 | 123.23 | 67.32 |
| 7 | BOD (mg/l) | 6.2 | 5 | 0.546 | 124 | 67.7 |
| 8 | Total hardness (mg/l) | 69.23 | 300 | 0.002 | 23.08 | 0.05 |
| 9 | NO3- (mg/l) | 0.87 | 45 | 0.012 | 1.93 | 0.02 |
| 10 | Chloride (mg/l) | 9.63 | 250 | 0.002 | 3.86 | 0.01 |
| 11 | Alkalinity (mg/l) | 0.73 | 120 | 0.005 | 0.61 | 0.01 |
| 12 | Calcium (mg/l) | 75 | 75 | 0.007 | 100 | 0.7 |
| 13 | Magnesium | 17.67 | 30 | 0.018 | 58.9 | 1.06 |
| In Total | 1.43 | 757.76 | 151.63 |
Table 4: Calculation of water quality index for sampling site C
Tables 2-4 showed calculation of water Quality index for the sites A, B and C, respectively. The highest water quality Index was recorded in sampling site A and the lowest Index was recorded in sampling site C (Table 5).
| Sampling sites | Water Quality Index |
|---|---|
| A | 141 |
| B | 112 |
| C | 106 |
Table 5: Water quality index for the sampling sites
Drinking water should be colourless. The determination of colour of the lake showed that the colour value for site A was highest, followed by that of sites C and B. There was significant difference in colour value between sites A and B; sites A and C but there was no significant difference between sites B and C. Colour in drinking water may be due to the presence of coloured organic matter, e.g. humic substances, metals such as iron and manganese, or highly coloured industrial wastes. Hence, the determination of colour can assist in the estimation of costs for the discoloration of the water.
The turbidity of water can be related to the expression of optical property and reflects the intensity of light scattered by the particles present in the water. The highest turbidity value was recorded for site A and the lowest value for site B. There was significant difference in turbidity values between sites A and B; sites A and C but there were no significant difference between sites B and C. Turbidity in site A is higher than regulatory limits of 5 mg/l [14]. This relatively high turbidity in site A explained the non-visibility of the bed of the surveyed water from the surface which may affect the transmission of sunlight rays and hence have effect on the production capacity of bottom dwelling phytoplankton. The turbid conditions may increase the possibility for waterborne disease. Turbidity may be due to organic and/or inorganic constituents result from decaying organic matter and runoff from densely populated Apete community. When turbidity is largely due to organic particles, dissolved oxygen depletion may occur in the water body.
pH is a measure of hydrogen ion concentration; it is an indicator of the existence of chemical and biological life and thus determine the suitability of water for various purposes e.g. low pH permits toxic elements and compounds to become mobile and available for uptake by aquatic plants and animals [15]. There was no significant difference in pH values among the sites. pH range in this study was between 6.8 and 7.6 and the values in many of the samplings remained exactly neutral. This is in consonant with the study of Yogendra and Puttaiah [16] on urban water body in Shimoga town. Better fish production is possible in water with pH range of 6.5 to 9.0. [17]. In this study, the pH values varied from 6.8 to 7.6, which indicate the favorable condition of productivity.
Conductivity indicates the presence of ions within the water; it indicates the capability of the water to transmit electric current and served as a tool to assess the purity of water [18]. The highest value was recorded in site B while the lowest was recorded in site C. There was a significant difference in conductivity values among the sites. The conductivity of lakes depends largely on that of inflowing rivers, turnover rates and the soil of the catchment’s area [19].
TDS in water consist of inorganic salts and dissolved materials. It is simply the sum of cations and anion concentrations. The highest value was recorded in site C while the lowest value was recorded in site B. There was a significant difference in TDS values among the sites. The contamination of domestic waste water, garbage and other related wastes in the surface water body can be one among the reasons for increase in TDS measure [20]. The probable reason for the differences in TDS between sites may be due to differences in usage of water in these sites.
TSS is solids in water that can be trapped by a filter and are indication of the amount of erosion that took place nearby or upstream. TSS can include a wide variety of material, such as silt, decaying plant and animal matter, industrial wastes, and sewage. The highest value of TSS was recorded in site A and the lowest value in site C. There was a significant difference in TSS values among the sites. High concentrations of suspended solids can cause many problems for aquatic health and life. The decrease in water clarity caused by TSS can affect the ability of fish to see and catch food and reduce the rates of primary production.
DO2 is important in production and support of life. It determines the nature of an entire aquatic ecosystem to a great extent and is the most important parameter to study the quality of water [21]. There was significant difference in values of dissolved oxygen among the sites except between sites A and B. The highest value was recorded in site C and the lowest in site A. The low level of DO2 reflects the richness of organic matter, which consumes large amount of dissolved oxygen in the process of decomposition. Ara et al. [22] attributed low content of DO2 to organic pollution, inorganic reductants and other oxidizable substances. In addition, when turbidity is largely due to organic particles, dissolved oxygen depletion may occur in the water body.
BOD is a parameter to access the organic load in a water body. It determines the amount of oxygen required for biological oxidation of organic matter with the help of microbial activities. There were significant differences in BOD values among the sites. It has the highest value at site A and the lowest value at site C. BOD is a measure of organic pollution to both waste and surface water. High BOD is an indication of poor water quality which is more pronounced in site A.
COD is the amount of (dissolved) oxygen required to oxidize and stabilize (organic and inorganic content of) the sample solution. It is an indicator of organics in the water, usually used in conjunction with BOD. It is used to measure pollution of domestic and industrial waste as it gives valuable information about the pollution potential of industrial effluents and domestic sewage [23,24]. The COD values among the sites were significantly different in this study. The highest value was recorded in site A and the lowest in site C. It is possible to correlate BOD and COD and the ratio called ‘Biodegradability Index’ has been commonly used as an indicator for biodegradation capacity [25]. This correlation of BOD and COD aids the understanding of the toxic conditions and may also assist in monitoring the presence of toxic and non-biodegradable substances. The reported values for biodegradability index vary from 0.4 to 0.8 for municipal raw wastewater [26] while in this study; the Biodegradability Index is between 0.4 and 0.5 which means that the water is highly biodegradable.
Alkalinity is not a pollutant. Alkalinity is defined as the quantities of base that are present in aquatic ecosystem and the higher a lake’s alkalinity, the greater its resistance to a decline in pH. The values of alkalinity showed significant difference among the sites. The highest value of alkalinity was recorded in site A and the lowest in site C. Alkalinity is important for fish and aquatic life because it keeps the pH fairly constant and makes water less vulnerable to acid rain which can be hazardous to aquatic life.
The highest value of hardness is found in site B and the lowest amount was found in site A. The values of hardness were significantly different among the sites. Calcium and magnesium ions in the lake form the total harness of the water. The degree of hardness of drinking water is important for aesthetic acceptability by consumers and for economic considerations. In addition, hardness levels limit phytoplankton formation and play a role in fish growth. The range of hardness (62-73 mg/l) obtained in this study shows that the water is moderately hard according the classification of the U.S. Department of Interior and the Water Quality Association.
Water Quality Index of Eleyele lake was established from thirteen important physico-chemical parameters. The Water Quality Index obtained for the lake at the different sites indicated the poor quality of the water according to the classification of Chatterjee and Raziuddin [27]. This makes the water unsuitable for human consumption without proper treatment. Low dissolved oxygen and high BOD indicate the polluted status of the lake. Hence, Water Quality Index for overall assessment of water quality of a lake is a useful tool. In addition, the highest values of colour, turbidity, total solid, total suspended solid, BOD, COD, alkalinity, phosphate, chloride, magnesium, nitrate, total organic carbon, total organic matter recorded in sampling site A than the other sites points to the fact that the highest level of organic pollutants that enter the lake from this area. This agrees with Solanki and Pandit [28] who related the concentration of chlorides to the impurity of water and Khare et al. [29] who reported that chloride is one of the important indicators of pollution. This may be the effects of domestic wastes from densely populated Apete community, Ibadan Polytechnic and University of Ibadan that are carried into the lake from Ona River. Furthermore, this explains the sudden take over the lake by Water hyacinth (Eichhornia crassipes) which now majorly covers the surface of the lake obstructing navigation and fishing activities on the lake thereby reducing the catch and source of food and income for local population.
The highest values of colour, turbidity, total solid, total suspended solid, BOD, COD, alkalinity, phosphate, chloride, magnesium, nitrate, total organic carbon, total organic matter recorded in sampling site A than the other sites. The Water Quality Indices of the three sampling sites, A, B and C are 141, 112 and 106, respectively. Hence, Water Quality Index can be used to compare the water quality among sites. These values for water quality rating as per Weight Arithmetic Water Quality Index according to Chatterjee and Raziuddin [27] and Tyagi et al. [30] clearly indicates that Eleyele lake water, though used for multi-purpose activities is polluted due to the continuous discharge of domestic and industrial wastes into it which makes it unsuitable for human consumption without proper treatment. Hence, the Ministry of Water Resources, Ministry of Health and that of Environment are to adopt and enforce a sustainable waste disposal and management system to curb the unrestricted and indiscriminate dumping of wastes into the lake.
A very special gratitude goes to Mr. MO Akinpelu of Kappa Biotechnology Laboratories, Ibadan, who assisted in carrying out most of the laboratory work and Mr. MI Adarabioyo who helped with statistical analyses of this study.