Research Article - Annals of Biological Research ( 2021) Volume 12, Issue 3
Received: 03-Mar-2021 Published: 31-Mar-2021
Highly significant effects of the environment (E), GxE interaction, and genotypes (G) had been observed by AMMI analysis for wheat genotypes evaluated under restricted irrigation timely sown multilocation trials in the North-Western Plains zone of the country during 2018-2019 and 2019-2020. Environments explained 63% and 43.3%, GxE interaction accounted for 18.4% and 37.8% whereas genotypes only 6.1% and 10.1% of total sum of squares due to treatments respectively. Ranking of genotypes had altered with the utilization of the number of IPCA’s for AMMI based and WAASB measures. Superiority indexes as per arithmetic, geometric and harmonic mean as well adaptability measures had identified HI1620, HI1628, HD3237, BRW 3806 genotypes. Biplot analysis based on 69.9% variations observed Adaptability measures deviated from other measures and maintained the right angle with MASV1 and stability measures. Cluster of Superiority indexes placed in the quadrant of adaptability measures. Second-year of study selected DBW296, HUW838, NIAW3170, JAUW672 wheat genotypes by Superiority indexes and adaptability measures for stable high yield. Biplot analysis observed 68.5% variability explained by two PC’s for studied measures. Adaptability measures as per various averages cluster in a different quadrant. Superiority indexes as per averages yield of wheat genotypes clustered in the same quadrant.
AMMI analysis, MASV, WAASB, SI, Biplot analysis
Anaysis of multi-location trials emphasied more on efficient estimation of genotypes, environments and interaction effects [1,2]. AMMI based several stability measures measures permit to evaluate genotype performance after substracting the noise from the GxE interaction effects [3,4]. Two distinct approaches, BLUP and AMMI, had been utilized to separate out the pattern (signal) from the random error (noise) components in GxE interactions [5,6]. Frequently these two models have been used separately in the field evaluation of genotypes under multi location trials [7]. The stability alone would not be a desirable selection criterion as stable genotypes might not achieve higher yields [8]. The simultaneous consideration of yield and stability in a single measure had been advocated [9]. Simultaneous Selection Indices had been developed by adding the corresponding ranks as per stability measure and yield performance of genotypes [10,11]. Taking into account the benefits of AMMI and BLUP techniques a measure of Superiority Index had been placed for stability and adaptability of genotypes [12]. The present study dealt with the merits of the analysis of GxE interaction and yield stability through AMMI with BLUP techniques for wheat genotypes evaluated under multi locations trials in the North Western Plains zone of India.
The states of Punjab, Haryana, and Delhi, Rajasthan (except Kota and Udaipur divisions), Western Uttar Pradesh (except Jhansi division and hilly areas), parts of Jammu and Kashmir (Jammu and Kathua districts) and parts of Himachal Pradesh (Paonta Valley and Una districts) categorised as the North Western Plains Zone of India. During 2018-2019 and 2019-2020 cropping seasons, ten wheat genotypes in advanced trials were evaluated at fourteen major locations of the zone and nine genotypes at thirteen locations under field trials by randomized complete block designs with three replications respectively. To harvest good yield of genotypes the recommended agronomic interventions were ensured. Tables 1 and 2 reflect the location conditions and parentage of evaluated wheat genotypes.
| Code | Genotype | Parentage | Location | Latitude | Longitude | Mean sea level |
|---|---|---|---|---|---|---|
| G 1 | HI 1620 | (NAC/TH.AC//3/PVN/3/MIRLO/BUC/4/2PASTOR/5/KACHU/6/KACHU) | Delhi | 28o4'N | 77 o13’E | 228 |
| G 2 | PBW 796 | (W15.92/4/PASTOR//HXL7573/2BAU/3/ WBLL1*2/5/WHEAR/SOKOLL) | Hisar | 29o10'N | 75o46’E | 229 |
| G 3 | HI 1628 | (FRET2*2/4/SNI/TRAP#1/3/KAUZ*2/TRAP//KAUZ/5/PFAU/WEAVER//BRAMBLING) | Bawal | 28o10'N | 76o50’E | 266 |
| G 4 | WH 1142 | (OEN/Ae.Sq.(TAUS)/FCT/3/2*WEAVER) | Karnal | 29o43'N | 70o58’E | 245 |
| G 5 | HD 3043 | (PJN/BOW//OPATA*2/3CROC_1/A.SQUARROSA(224)//OPATA) | Jammu | 32o40'N | 74o54’E | 356 |
| G 6 | PBW 644 | (PBW175/HD2643) | Ludhiana | 30 o54'N | 75o48’E | 247 |
| G 7 | HD 3237 | (HD3016/HD2967) | Gurdaspur | 30o02'N | 75o24’E | 265 |
| G 8 | BRW 3806 | (NI5439/MACS2496) | Kapurthala | 31°22'N | 75°22’E | 229 |
| G 9 | NIAW 3170 | (SKOLL/ROLF07) | Balachaur | 31°3'N | 76°18’E | 272 |
| G 10 | WH 1080 | (PRL/*2PASTOR) | Bulandshahr | 28o40'N | 77 o84’E | 195 |
| Pantnagar | 29o02'N | 79 o48’E | 243.8 | |||
| Diggi | 26°22'N | 75°26’E | 329.24 | |||
| Sriganganagar | 29o66'N | 75o53’E | 175.6 | |||
| Bharatpur | 27°13'N | 77°29’E | 182 |
Table 1: Details of location and parentage of evaluated genotypes (2018-2019).
| Code | Genotype | Parentage | Location | Latitude | Longitude | Mean sea level |
| G 1 | HUW838 | (WBLL12/BRAMBLING/4/BABAX/LR42//BABAX2/3/SHAMA2/5/PBW3432/KUKUNA2//FRTL/PIFED) | Delhi | 28o4'N | 77o13’E | 228 |
| G 2 | HD3043 | (PJN/BOW//OPATA2/3CROC_1/A.SQUARROSA(224)//OPATA) | Jammu | 32o40'N | 74o54’E | 356 |
| G 3 | PBW644 | (PBW175/HD2643) | Hisar | 29o10'N | 75 o46’E | 229 |
| G 4 | DBW296 | (DBW16/BH1146) | Karnal | 29o43'N | 70o58’E | 245 |
| G 5 | HI1628 | (FRET2*2/4/SNI/TRAP#1/3/KAUZ*2/TRAP//KAUZ/5/PFAU/WEAVER//BRAMBLING) | Ludhiana | 30o54'N | 247 | |
| G 6 | WH1080 | (PRL/*2PASTOR) | Gurdaspur | 30o02'N | 75o24’E | 265 |
| G 7 | JAUW672 | (SERI.18*2/3/KAUZ*2/BOW//KAUZ/4/CROC) | Kapurthala | 31°22'N | 75°22’E | 229 |
| G 8 | WH1142 | (OEN/Ae.Sq.(TAUS)/FCT/3/2*WEAVER) | Balachaur | 31°3'N | 76°18’E | 272 |
| G 9 | NIAW3170 | (SKOLL/ROLF07) | Bulandshahr | 28o40'N | 77o84’E | 195 |
| Nagina | 29o28'N | 78o32’E | 245 | |||
| Modipuram | 29o05'N | 77o70’E | 226 | |||
| Pantnagar | 29o02'N | 79o48’E | 243.8 | |||
| Sriganganagar | 29o66'N | 75o53’E | 175.6 |
Stability measure as Weighted Average of Absolute Scores has been calculated as

Where WAASBi was the weighted average of absolute scores of the ith genotype (or environment); IPCAik the score of the ith genotype (or environment) in the kth IPCA, and EPk was the amount of the variance explained by the kth IPCA. Superiority index allowed variable weights to yield and stability measure (WAASB) to select genotypes that combine high performance and stability
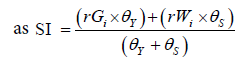
where rGi and rWi were the rescaled values for yield and WAASB, respectively, for the ith genotype; Gi and Wi were the yield and the WAASB values for ith genotype. SI superiority index for the ith genotype that weighted between yield and stability, and θY and θS were the weights for yield and stability assumed to be of order 65 and 35 respectively in this study, (Table 3).
| Stability measure as Weighted Average of Absolute Scores has been calculated as | ||
|---|---|---|
| Mohamadi et al. 2008 | Geometric Adaptability Index | GAI =  |
| Zali et al. 2012 | Modified AMMI stability Value | 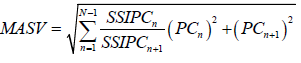 |
| Ajay et al. 2019 | MASVI |  |
| Resende et al. 2007 | Relative performance of genotypic values across environments | PRVGij = VGij/VGi |
| Resende et al. 2007 | Harmonic mean of Relative performance of genotypic values | MHPRVGi. = Number of environments  |
| Oliveto et al. 2019 | Superiority Index | 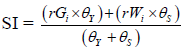 |
AMMI analysis was performed using AMMISOFT version 1.0, available at https://scs.cals.cornell.edu/people/ hugh-gauch/ and SAS software version 9.3. Stability measures had been compared with recent analytic measures of adaptability calculated as the relative performance of genetic values (PRVG) and harmonic mean based measure of the relative performance of the genotypic values (MHPRVG) for the simultaneous analysis of stability, adaptability, and yield [13].
First year 2018-2019
Effects of the environment (E), GxE interaction, and genotypes (G) were highly significant as observed by AMMI analysis of variance of 10 wheat genotypes evaluated at fourteen locations of the zone under restricted irrigation timely sown conditions (Table 4). Analysis observed the greater contribution of environments, GxE interactions, and genotypes to the total sum of squares (SS) as compared to the residual effects. Further SS attributable to GxE interactions was partitioned as attributed to GxE interactions Signal and GxE interactions Noise. AMMI analysis is appropriate for data sets where-in SS due to were of magnitude at least of due to additive genotype main effects [14]. The SS for GxE interactions Signal was higher compared to genotype main effects, indicated appropriateness of AMMI analysis. About 63% of the total sum of squares due to treatments explained by environment effects, 18.4% by GxE interaction and genotypes only 6.1% of the total sum of squares. Higher values of GxE interaction (sum of squares) as compared to genotypes indicated complex GxE interaction as far as the yield of genotypes was concerned. Similar nature of more GxE interaction effects over genotype was reported in several studies thus making the selection of stable genotype difficult. Significant seven multiplicative terms accounted for 97.4 % of interaction sum of squares and remaining 2.6% residual was discarded [15].
| Source | Degree of | Degree of | Mean Sum | Mean sum of squares (19-20) | Level of significance (18-19) | Level of significance (19-20) |
|---|---|---|---|---|---|---|
| freedom (18-19) | freedom (19-20) | of Squares (18-19) | ||||
| Treatments | 139 | 116 | 301.61 | 369.04 | .0000000 | .0000000 |
| Genotypes (G) | 9 | 8 | 324.07 | 589.01 | .0000000 | .0000000 |
| Environments (E) | 13 | 12 | 2323.64 | 1696.76 | .0000000 | .0000000 |
| Interactions GxE | 117 | 96 | 75.21 | 184.74 | .0000000 | .0000000 |
| IPC1 | 21 | 19 | 96.88 | 351.09 | .0000000 | .0000000 |
| IPC2 | 19 | 17 | 91.48 | 290.1 | .0000000 | .0000000 |
| IPC3 | 17 | 15 | 84.99 | 193.39 | .0000000 | .0000000 |
| IPC4 | 15 | 13 | 90.42 | 102.86 | .0000000 | .0000000 |
| IPC5 | 13 | 11 | 85.64 | 98.15 | .0000000 | .0000000 |
| IPC6 | 11 | 9 | 45.76 | 62.35 | .0000393 | .0000017 |
| IPC7 | 9 | 7 | 42.6 | 27.71 | .0050415 | .0433657 |
| Residual | 12 | 5 | 18.82 | 11.94 | 0.2080101 | 0.3999902 |
| Error | 420 | 351 | 14.34 | 11.6 | ||
| Total | 559 | 467 | 85.77 | 100.39 |
Ranking of genotypes vis-à-vis number of IPCA’s
IPCA of genotypes in the AMMI analysis indicates stability or adaptability of tested genotypes over considered locations. Higher values of the IPCA scores dictate the specific adaptation of genotype to certain locations. More of the IPCA score approximating to zero value allow the more stable or adaptation of the genotypes to all the locations. The ranking of genotype as per absolute IPCA-1 scores were HI1628, HD3043, PBW644 (Table 5). While for IPCA-2, genotypes HD3043, WH1080, PBW644 would be of choice. Values of IPCA-3 favoured PBW644, HD3237, HI1628 wheat genotypes. As per IPCA-4, WH1080, PBW796, HI1628 genotypes would be of stable performance. HD3237, HD3043, WH1142 genotypes pointed by IPCA-5 measure. Genotypes HI1628, PBW644, WH1080 identified by absolute values of IPCA-6. Lastly, IPCA-7 settled for NIAW3170, PBW644, PBW796 genotypes for the studied locations of the zone. Analytic measures of adaptability MASV and MASV1 consider all the significant IPCAs for the indexing of genotypes. Values of MASV1 identified genotypes HD3237, WH1080, and HI1620 would express stable yield whereas same wheat genotypes HD3237, WH1080 and HI1620 be of selected by MASV measure also [16].
| Genotype | IPCA1 | IPCA2 | IPCA3 | IPCA4 | IPCA5 | IPCA6 | IPCA7 | MASV1 | MASV | R MASV1 | R MASV |
|---|---|---|---|---|---|---|---|---|---|---|---|
| HI 1620 | 1.606 | -1.011 | -0.482 | -1.726 | 0.914 | 1.322 | 0.425 | 4.878 | 4.39 | 3 | 3 |
| PBW 796 | 2.417 | 0.865 | 0.832 | -0.445 | -1.842 | 1.095 | -0.394 | 5.933 | 4.917 | 8 | 5 |
| HI 1628 | 0.004 | -1.579 | 0.434 | 0.481 | 2.703 | 0.163 | 0.467 | 7.101 | 5.491 | 10 | 8 |
| WH 1142 | -2.726 | 2.327 | -0.674 | -1.42 | 0.479 | 0.553 | -0.341 | 5.631 | 5.253 | 6 | 7 |
| HD 3043 | 0.286 | -0.022 | 2.578 | -0.792 | 0.32 | -1.889 | -1.166 | 5.248 | 5.016 | 5 | 6 |
| PBW 644 | -0.467 | -0.549 | 0.153 | 3.008 | -0.744 | 0.294 | 0.194 | 5.205 | 4.801 | 4 | 4 |
| HD 3237 | -0.754 | 0.585 | 0.225 | 1.392 | 0.316 | 1.088 | -1.215 | 3.439 | 3.218 | 1 | 1 |
| BRW 3806 | -1.278 | -2.752 | -1.694 | -0.92 | -1.7 | -0.61 | -0.579 | 6.884 | 6.073 | 9 | 10 |
| NIAW 3170 | 1.831 | 1.645 | -2.544 | 0.68 | 0.542 | -1.598 | 0.186 | 5.908 | 5.583 | 7 | 9 |
| WH 1080 | -0.921 | 0.492 | 1.172 | -0.258 | -0.989 | -0.418 | 2.424 | 4.119 | 3.733 | 2 | 2 |
To identify how the ranks of evaluated wheat genotype altered with utilizing numbers of IPCA in the WAASB estimation, the genotype’s ranks were obtained while considering 1, 2,..7 IPCA’s in the WAASB calculations. WAASB = |IPCA1| for using only first IPCA. The genotype with the smallest WAASB value had been ranked with the first-order. Genotypes preferences varied as HI1628, HD3043, PBW644 based on W1 whereas HD3043, PBW644, HD3237 as per W2 values while PBW644, HD3237, HI1628 by values of W3 (Table 6). Genotypes HI1628, WH1080, HD3237 were pointed by W4; W5 favoured HD3237, WH1080, HD3043, and lastly by W6 genotypes of choice would be HD 3237, WH1080, HD3043. Stability measure WAASB based on all the seven significant IPCA’s settled for HD3237, WH1080, PBW644 genotypes for considered locations of the zone for stable high yield. The ranking of studied genotypes had been altered by the number of IPCAs included in the calculation of WAASB measure. This reinforced the benefits of using the WAASB index since it captured the total variations accounted by significant IPCAs to compute the stability [17].
| Genotype | W1 | W2 | W3 | W4 | W5 | W6 | WAASB | RW1 | RW2 | RW3 | RW4 | RW5 | RW6 | RWAASB |
|---|---|---|---|---|---|---|---|---|---|---|---|---|---|---|
| HI 1620 | 1.606 | 1.317 | 1.058 | 1.224 | 1.165 | 1.179 | 1.12 | 7 | 6 | 6 | 7 | 6 | 6 | 6 |
| PBW 796 | 2.417 | 1.663 | 1.405 | 1.166 | 1.295 | 1.276 | 1.207 | 9 | 7 | 7 | 6 | 7 | 7 | 7 |
| HI 1628 | 0.004 | 0.769 | 0.665 | 0.619 | 1.016 | 0.937 | 0.9 | 1 | 5 | 3 | 1 | 5 | 5 | 5 |
| WH 1142 | 2.726 | 2.532 | 1.954 | 1.821 | 1.566 | 1.472 | 1.382 | 10 | 10 | 9 | 10 | 9 | 9 | 9 |
| HD 3043 | 0.286 | 0.158 | 0.91 | 0.881 | 0.774 | 0.877 | 0.9 | 2 | 1 | 5 | 4 | 3 | 3 | 4 |
| PBW 644 | 0.467 | 0.507 | 0.397 | 1.046 | 0.988 | 0.924 | 0.866 | 3 | 2 | 1 | 5 | 4 | 4 | 3 |
| HD 3237 | 0.754 | 0.672 | 0.533 | 0.747 | 0.664 | 0.704 | 0.744 | 4 | 3 | 2 | 3 | 1 | 1 | 1 |
| BRW 3806 | 1.278 | 1.994 | 1.901 | 1.657 | 1.665 | 1.568 | 1.489 | 6 | 9 | 8 | 8 | 10 | 10 | 10 |
| NIAW 3170 | 1.831 | 1.741 | 1.99 | 1.665 | 1.451 | 1.465 | 1.363 | 8 | 8 | 10 | 9 | 8 | 8 | 8 |
| WH 1080 | 0.921 | 0.713 | 0.856 | 0.707 | 0.761 | 0.729 | 0.863 | 5 | 4 | 4 | 2 | 2 | 2 | 2 |
Rw1, Rw2, Rw3, Rw4, Rw5, Rw6, RWAASB = Rank of genotypes as per number of IPCA’s in WAASB values
Stable productive genotypes by AMMI and BLUP
Mean of a genotype across locations identified HI1620, HI1628, NIAW3170 wheat genotypes (Table 7). This method is simple, but not fully exploiting all information contained in the dataset. Geometric mean was suggested to evaluate the adaptability of genotypes. High values of Geometric mean selected HI1620, HI1628, BRW3806 genotypes as of desire. The harmonic mean of genetic values (HMGV) proposed by Resend, to rank genotypes considering the yield and stability simultaneously [18]. Harmonic Mean of genotypes recommended HI1620, HI1628, BRW 380 genotypes. Moreover, the Harmonic Mean of Relative Performance of Genotypic Values (HMRPGV) method proposed by Resende et al., [19]. Similar to the methods of Lin et al., [20,21]. In the HMRPGV method for stability analysis, the genotypes can be simultaneously sorted by genotypic values (yield) and stability using the harmonic means of the yield so that the smaller the standard deviation of genotypic performance among the locations. Wheat genotypes HI1620, HI1628, HD3237 pointed out by HMRPGV. When considering the yield and adaptability simultaneously, the recommended approach is the Relative Performance of Genetic Values (RPGV) overcrop years. For adaptability analysis, the Relative Performance of Genotypic Values had measured across environments and genotypes. Relative Performance of Genotypic Values inclined towards HI1620, HI1628, BRW3806 genotypes.
| Genotype | AMu | Rk | SI au | Rk | GMu | Rk | SI gu | Rk | HMu | Rk | SI hu | Rk | MHRPGVu | Rk | RPGVu | Rk |
|---|---|---|---|---|---|---|---|---|---|---|---|---|---|---|---|---|
| HI 1620 | 51.83 | 1 | 82.37 | 1 | 51.3971 | 1 | 82.37 | 1 | 51 | 1 | 82.37 | 1 | 1.066 | 1 | 1.071 | 1 |
| PBW 796 | 48.98 | 6 | 49.36 | 5 | 48.15447 | 6 | 46.11 | 5 | 47.34 | 6 | 43.15 | 6 | 0.998 | 6 | 1.004 | 6 |
| HI 1628 | 50.4 | 2 | 78.16 | 3 | 50.00022 | 2 | 78.81 | 2 | 49.61 | 2 | 79.35 | 2 | 1.037 | 2 | 1.042 | 2 |
| WH 1142 | 47.98 | 7 | 30.95 | 9 | 46.97666 | 7 | 26.16 | 10 | 46.05 | 7 | 22.45 | 10 | 0.972 | 7 | 0.981 | 7 |
| HD 3043 | 45.42 | 10 | 27.68 | 10 | 44.84521 | 10 | 27.68 | 9 | 44.23 | 10 | 27.68 | 9 | 0.93 | 10 | 0.935 | 10 |
| PBW 644 | 46.15 | 8 | 36.68 | 7 | 45.45283 | 8 | 35.29 | 7 | 44.82 | 8 | 34.89 | 7 | 0.942 | 8 | 0.947 | 8 |
| HD 3237 | 49.84 | 4 | 79.79 | 2 | 49.14596 | 4 | 77.67 | 3 | 48.49 | 4 | 75.91 | 3 | 1.021 | 3 | 1.023 | 5 |
| BRW 3806 | 49.65 | 5 | 42.95 | 6 | 49.23547 | 3 | 43.55 | 6 | 48.83 | 3 | 44.17 | 5 | 1.019 | 4 | 1.028 | 3 |
| NIAW 3170 | 49.96 | 3 | 51.91 | 4 | 49.12554 | 5 | 48.39 | 4 | 48.33 | 5 | 45.32 | 4 | 1.018 | 5 | 1.025 | 4 |
| WH 1080 | 46.08 | 9 | 36.13 | 8 | 45.26195 | 9 | 33.53 | 8 | 44.45 | 9 | 31.5 | 8 | 0.939 | 9 | 0.943 | 9 |
AMu, GMu, HMu = Arithmetic, Geometric, Harmonic Mean for BLUP values; SI au, SI gu, SI hu = Superiority Index as per Arithmetic, Geometric, Harmonic Mean; RPGVu, MHRPGVu = Relative performance and Harmonic mean of Relative Performance as per BLUP of genotypes; Rk = Rank of genotypes.
While keeping 65 and 35 weights to average yield and stability, the Superiority Index (SI) pointed out HI1620, HD3237, HI1628 genotypes would maintain high yield and stable performance. Moreover, SI for considering GAI and stability selected HI1620, HI1628, HD 3237 genotypes. However, the values of SI while considering HM of genotypic yield favoured the same set of wheat genotypes HI1620, HI1628, HD3237. Genotypes HI1620, HI 628, BRW 3806 observed more adaptable to considered locations by RPGV, MHRPGV, and SI measures.
Biplot analysis of measures
Principal components analysis was performed to study the relationships among the stability and adaptability measures of evaluated wheat genotypes [22]. Loadings of the considered measures were tabulated as per the first two significant PC as explained 69.9% of the total variation in the original variables with respective contributions were 38.5 and 31.5 percent (Table 8). The first group comprised of MASV, MASV1 and stability measures by utilizing the varying number of interaction principal components for calculation (Figure 1). Adaptability measures as per arithmetic, geometric and harmonic means and their corresponding values expressed tight relationship as placed in a different quadrant. This quadrant also showed a cluster of Superiority indexes as per averages of the yield of wheat genotypes. Performance of genotypes would be different by Superiority indexes as compared to their behaviour as per values of MASV, MASV1 and stability measures.
| Component | PC1 | PC2 |
|---|---|---|
| IPCA1 | -0.0743 | 0.1056 |
| IPCA2 | 0.0471 | -0.1304 |
| IPCA3 | 0.2571 | 0.0659 |
| IPCA4 | 0.1376 | 0.0892 |
| IPCA5 | -0.0451 | 0.1886 |
| IPCA6 | -0.0768 | 0.1649 |
| IPCA7 | 0.0592 | 0.0147 |
| MASV1 | -0.1736 | -0.1025 |
| MASV | -0.1685 | -0.1845 |
| W1 | -0.1825 | -0.1887 |
| W2 | -0.255 | -0.1902 |
| W3 | -0.2225 | -0.2482 |
| W4 | -0.2155 | -0.2491 |
| W5 | -0.2609 | -0.211 |
| W6 | -0.2642 | -0.2127 |
| WAASB | -0.2528 | -0.2301 |
| AMu | -0.2826 | 0.1837 |
| SI au | -0.1422 | 0.3248 |
| GMu | -0.2774 | 0.1951 |
| SI gu | -0.1378 | 0.3295 |
| HMu | -0.2717 | 0.2034 |
| SI hu | -0.1327 | 0.3321 |
| RPGVu | -0.2811 | 0.1886 |
| MHRPGVu | -0.2731 | 0.2021 |
| % variation explained | 38.35 | 31.59 |

Figure 1. Biplot analysis of measures as per first two significant PCA’s (2018-2019).
Second year 2019-2020
Highly significant effects of the environment (E), GxE interaction, and genotypes (G) were observed by the AMMI analysis. About 43.3% of the total sum of squares due to treatments explained by environmental effects. Genotypes explained 10.1% of the total sum of squares, whereas GxE interaction explained 37.8% of treatment variation in yield. The larger magnitude of GxE interaction (sum of squares) than genotypes indicated the presence of genotypic differences across environments and complex GxE interaction for wheat yield. Further partitioning of GxE interaction observed that the seven multiplicative terms expalined 98.6% of the interaction sum of squares.
Ranking of genotypes vis-à-vis number of IPCA’s
Genotypes PBW644, NIAW3170, JAUW672 were ranked as per absolute IPCA-1 scores. While IPCA-2 selected, WH108, HD3043, WH1142 genotypes of choice (Table 9). Values of IPCA-3 favoured WH1142, NIAW3170, HUW838 wheat genotypes. As per IPCA-4, DBW296, PBW644, NIAW3170 genotypes would be of stable performance. HD3043, PBW644, HUW838 genotypes pointed by IPCA-5 measure. Genotypes WH108, JAUW672, NIAW3170 were identified by absolute values of IPCA-6. Lastly, IPCA- 7 settled for PBW644, HI1628, WH108 genotypes for the studied locations of the zone. MASV and MASV1 consider all significant IPCAs of the analysis. Values of analytic measures of adaptability MASV1 identified genotypes HUW838, WH1142, HD3043 would express stable yield whereas genotypes HUW838, WH1142, DBW296 be of stable performance by MASV measure respectively.
| Genotype | IPCA1 | IPCA2 | IPCA3 | IPCA4 | IPCA5 | IPCA6 | IPCA7 | MASV1 | MASV | RIPCA1 | RMASV1 | RMASV |
|---|---|---|---|---|---|---|---|---|---|---|---|---|
| HUW838 | 2.607 | 1.172 | 0.649 | -2.128 | 0.458 | -0.659 | -1.207 | 6.18 | 5.3 | 7 | 1 | 1 |
| HD3043 | -2.327 | -0.511 | 1.365 | -2.411 | -0.138 | -0.991 | 0.781 | 6.8 | 5.61 | 5 | 3 | 4 |
| PBW644 | -0.091 | -3.61 | 1.628 | -0.09 | -0.311 | 2.134 | -0.179 | 10.44 | 7.85 | 1 | 9 | 9 |
| DBW296 | 1.69 | 1.448 | -1.911 | -0.05 | 0.6 | 1.401 | -0.506 | 7.39 | 5.48 | 4 | 4 | 3 |
| HI1628 | 2.559 | -3.098 | -1.728 | 1.039 | -0.557 | -1.699 | 0.363 | 9.89 | 7.68 | 6 | 8 | 8 |
| WH108 | -2.795 | 0.067 | -2.712 | -0.151 | 1.918 | 0.226 | 0.505 | 8.62 | 6.72 | 8 | 6 | 6 |
| JAUW672 | 0.903 | 1.441 | 2.806 | 2.079 | 1.885 | -0.363 | 0.609 | 9.15 | 7.25 | 3 | 7 | 7 |
| WH1142 | -3.189 | 0.574 | 0.201 | 1.577 | -1.306 | -0.673 | -1.558 | 6.41 | 5.43 | 9 | 2 | 2 |
| NIAW3170 | 0.643 | 2.518 | -0.298 | 0.136 | -2.549 | 0.623 | 1.193 | 7.85 | 6.32 | 2 | 5 | 5 |
PBW644, NIAW3170, JAUW672 genotypes preferred by W1 measure whereas JAUW672, NIAW3170, HD3043 as per W2 values while NIAW3170, HD3043, JAUW672 by values of W3 (Table 10). Wheat genotypes NIAW3170, DBW296, PBW644 were pointed by W4; values of W5 measure favoured NIAW3170, PBW644, DBW296 and lastly by W6 values genotypes of choice would be NIAW3170, DBW296, HD3043. WAASB stability measure utilized all significant IPCA’s settled for NIAW3170, DBW296, PBW644 genotypes for considered locations of the zone for stable high yield. Rankings of the genotypes were altered by the number of IPCAs included in the WAASB measure.
| Genotype | W1 | W2 | W3 | W4 | W5 | W6 | WAASB | RW1 | RW2 | RW3 | RW4 | RW5 | RW6 | RWAASB |
|---|---|---|---|---|---|---|---|---|---|---|---|---|---|---|
| HUW838 | 2.607 | 1.958 | 1.655 | 1.707 | 1.588 | 1.536 | 1.527 | 7 | 7 | 5 | 8 | 6 | 6 | 7 |
| HD3043 | 2.327 | 1.505 | 1.473 | 1.576 | 1.439 | 1.414 | 1.398 | 5 | 3 | 2 | 4 | 4 | 3 | 4 |
| PBW644 | 0.091 | 1.683 | 1.67 | 1.497 | 1.385 | 1.427 | 1.396 | 1 | 6 | 7 | 3 | 2 | 4 | 3 |
| DBW296 | 1.69 | 1.581 | 1.657 | 1.481 | 1.397 | 1.398 | 1.376 | 4 | 5 | 6 | 2 | 3 | 2 | 2 |
| HI1628 | 2.559 | 2.803 | 2.554 | 2.388 | 2.214 | 2.185 | 2.14 | 6 | 9 | 9 | 9 | 9 | 9 | 9 |
| WH1080 | 2.795 | 1.561 | 1.828 | 1.644 | 1.67 | 1.588 | 1.561 | 8 | 4 | 8 | 7 | 8 | 8 | 8 |
| JAUW672 | 0.903 | 1.146 | 1.531 | 1.591 | 1.619 | 1.548 | 1.524 | 3 | 1 | 3 | 6 | 7 | 7 | 6 |
| WH1142 | 3.189 | 2.006 | 1.588 | 1.586 | 1.56 | 1.51 | 1.511 | 9 | 8 | 4 | 5 | 5 | 5 | 5 |
| NIAW3170 | 0.643 | 1.491 | 1.215 | 1.096 | 1.234 | 1.199 | 1.199 | 2 | 2 | 1 | 1 | 1 | 1 | 1 |
Stabe productive genotypes by AMMI and BLUP
Maximum average yield expressed by HUW838 and followed by DBW296 while exploiting BLUP’s of wheat genotypes across considered locations. Genotypes were ranked as HUW838, DBW296 and NIAW3170 as of the order of choice (Table 11). GAI values observed the higher values associated with DBW296, HUW838 and NIAW3170. The harmonic mean of genotypic values settled for DBW296, HUW838 and JAUW672 genotypes. SI based on average yield and stability identified DBW296, HUW838, NIAW3170 whereas SI considering GAI pointed towards DBW296, HUW838, NIAW3170. Moreover, the values of superiority index utilizing harmonic mean of yield values found suitability of DBW296, HUW838 and NIAW3170. Analytic measures of adaptability RPGV selected DBW296, HUW838, JAUW672, and MHRPGV measure observed DBW296, HUW838, NIAW3170 as both settled for the least stable yield of PBW644 and HD3043.
| Genotype | Amu | Rk | SI au | Rk | Gmu | Rk | SI gu | Rk | Hmu | Rk | SI hu | Rk | MHRPGVu | Rk | RPGVu | Rk |
|---|---|---|---|---|---|---|---|---|---|---|---|---|---|---|---|---|
| HUW838 | 58.43 | 1 | 87.79 | 2 | 57.73 | 2 | 86.66 | 2 | 57 | 2 | 85.05 | 2 | 1.083 | 2 | 1.094 | 2 |
| HD3043 | 50.29 | 8 | 31.73 | 7 | 49.4 | 9 | 27.59 | 8 | 48.53 | 9 | 27.59 | 8 | 0.926 | 8 | 0.938 | 9 |
| PBW644 | 49.74 | 9 | 27.66 | 8 | 49.41 | 8 | 27.75 | 7 | 49.06 | 8 | 31.58 | 6 | 0.925 | 9 | 0.938 | 8 |
| DBW296 | 58.41 | 2 | 93.29 | 1 | 57.87 | 1 | 93.44 | 1 | 57.37 | 1 | 93.44 | 1 | 1.088 | 1 | 1.096 | 1 |
| HI1628 | 51.29 | 7 | 11.65 | 9 | 51.03 | 6 | 12.54 | 9 | 50.78 | 5 | 16.52 | 9 | 0.954 | 6 | 0.97 | 6 |
| WH1080 | 51.97 | 5 | 38.24 | 5 | 51.21 | 5 | 35.48 | 5 | 50.49 | 6 | 36 | 5 | 0.958 | 5 | 0.974 | 5 |
| JAUW672 | 54.42 | 4 | 57.94 | 4 | 53.62 | 3 | 55.27 | 4 | 52.9 | 3 | 55.02 | 4 | 1.006 | 4 | 1.016 | 3 |
| WH1142 | 51.48 | 6 | 36.48 | 6 | 50.52 | 7 | 32 | 6 | 49.63 | 7 | 31.52 | 7 | 0.946 | 7 | 0.96 | 7 |
| NIAW3170 | 54.54 | 3 | 70.91 | 3 | 53.56 | 4 | 66.88 | 3 | 52.61 | 4 | 65.04 | 3 | 1.006 | 3 | 1.014 | 4 |
Biplot analysis of measures
The first two significant PC’s had explained 68.5% of the total variation with respective contributions was of order 44.2 and 24.2 percent (Table 12). Four groups of measures were observed in graphical Biplot analysis. The smallest group comprised of MASV and MASV1 measures (Figure 2). The nearby group clustered stability measures by utilizing the varying number of interaction principal components for calculation. Adaptability measures as per arithmetic, geometric and harmonic means and their corresponding values expressed bondage in the group placed in a different quadrant. However, this group maintained the right angle with stability measures. This quadrant also showed a cluster of Superiority indexes as per averages of the yield of wheat genotypes. Performance of genotypes would not be different by Superiority indexes as well as by adaptability measures.
| Component | PC1 | PC2 |
|---|---|---|
| IPCA1 | 0.0876 | -0.2609 |
| IPCA2 | 0.2477 | 0.0215 |
| IPCA3 | 0.0175 | 0.1843 |
| IPCA4 | -0.0826 | -0.024 |
| IPCA5 | 0.0127 | -0.103 |
| IPCA6 | 0.1161 | 0.1947 |
| IPCA7 | -0.0617 | 0.1425 |
| MASV1 | -0.1747 | 0.0253 |
| MASV | -0.1944 | 0.0272 |
| W1 | -0.0589 | -0.2086 |
| W2 | -0.1631 | -0.2738 |
| W3 | -0.201 | -0.2969 |
| W4 | -0.1994 | -0.3054 |
| W5 | -0.2013 | -0.3024 |
| W6 | -0.2099 | -0.2984 |
| WAASB | -0.208 | -0.3015 |
| AMu | 0.2667 | -0.2 |
| SI au | 0.3016 | -0.0704 |
| GMu | 0.2583 | -0.2164 |
| SI gu | 0.298 | -0.0881 |
| HMu | 0.2486 | -0.2308 |
| SI hu | 0.2946 | -0.0966 |
| RPGVu | 0.2564 | -0.2213 |
| MHRPGVu | 0.2609 | -0.2104 |
| % variation explained | 44.27 | 24.22 |

Figure 2: Biplot analysis of measures as per first two significant PC’s (2019-2020).
AMMI model had been established as an effective tool to study GxE interaction in multi-environment trials. Stability measures considering stability and yield simultaneously would be more appropriate to recommend high-yielding stable wheat genotypes. The fact is that both BLUP and AMMI have their efficacy increased depending on factors intrinsic to each trial. In the present study, the main advantages of AMMI and BLUP had been combined to increase the reliability of multi-locations trials analysis. The more interesting advantage provided by Superiority Indexes that different weights may be assigned to the yield performance and stability. As per the goal of a breeding program or a cultivar recommendation trial, the researcher may prioritize the productivity of a genotype rather than its stability (and vice-versa). The stability index of genotype performance has the potential to provide reliable estimates of stability in future studies along with a joint interpretation of performance and stability in a biplots while considering more of IPCA’s.
The wheat genotypes were evaluated at research fields at coordinated centres of AICW and BIP across the country. The first author sincerely acknowledges the hard work of all the staff for field evaluation and data recording of wheat genotypes.
The authors declared no conflict of interests.